.jpg?downsize=773:435)
The last letter was entitled ‘Time to Change Strategies.' We had all quite gotten used to a strategy of buying the dips for the past couple of years. Because it worked. Ever since the market topped on Sep 27th, the market has been sending out subtle signals that it is possibly shifting gears. But most of us either didn't hear it or did not want to hear it. But now, the market is forcing that decision down the throat!
I started warning of this impending reaction from the letter of 27th Sep (see Price and Time confluence ahead). That letter showed a chart where the prices were hitting the pitchfork channel top, and the time count for Oct 3rd was forecasted. A clear indication that traders should take profits was also made. Chart 1 here is a reproduction of the time forecast chart given in that letter.
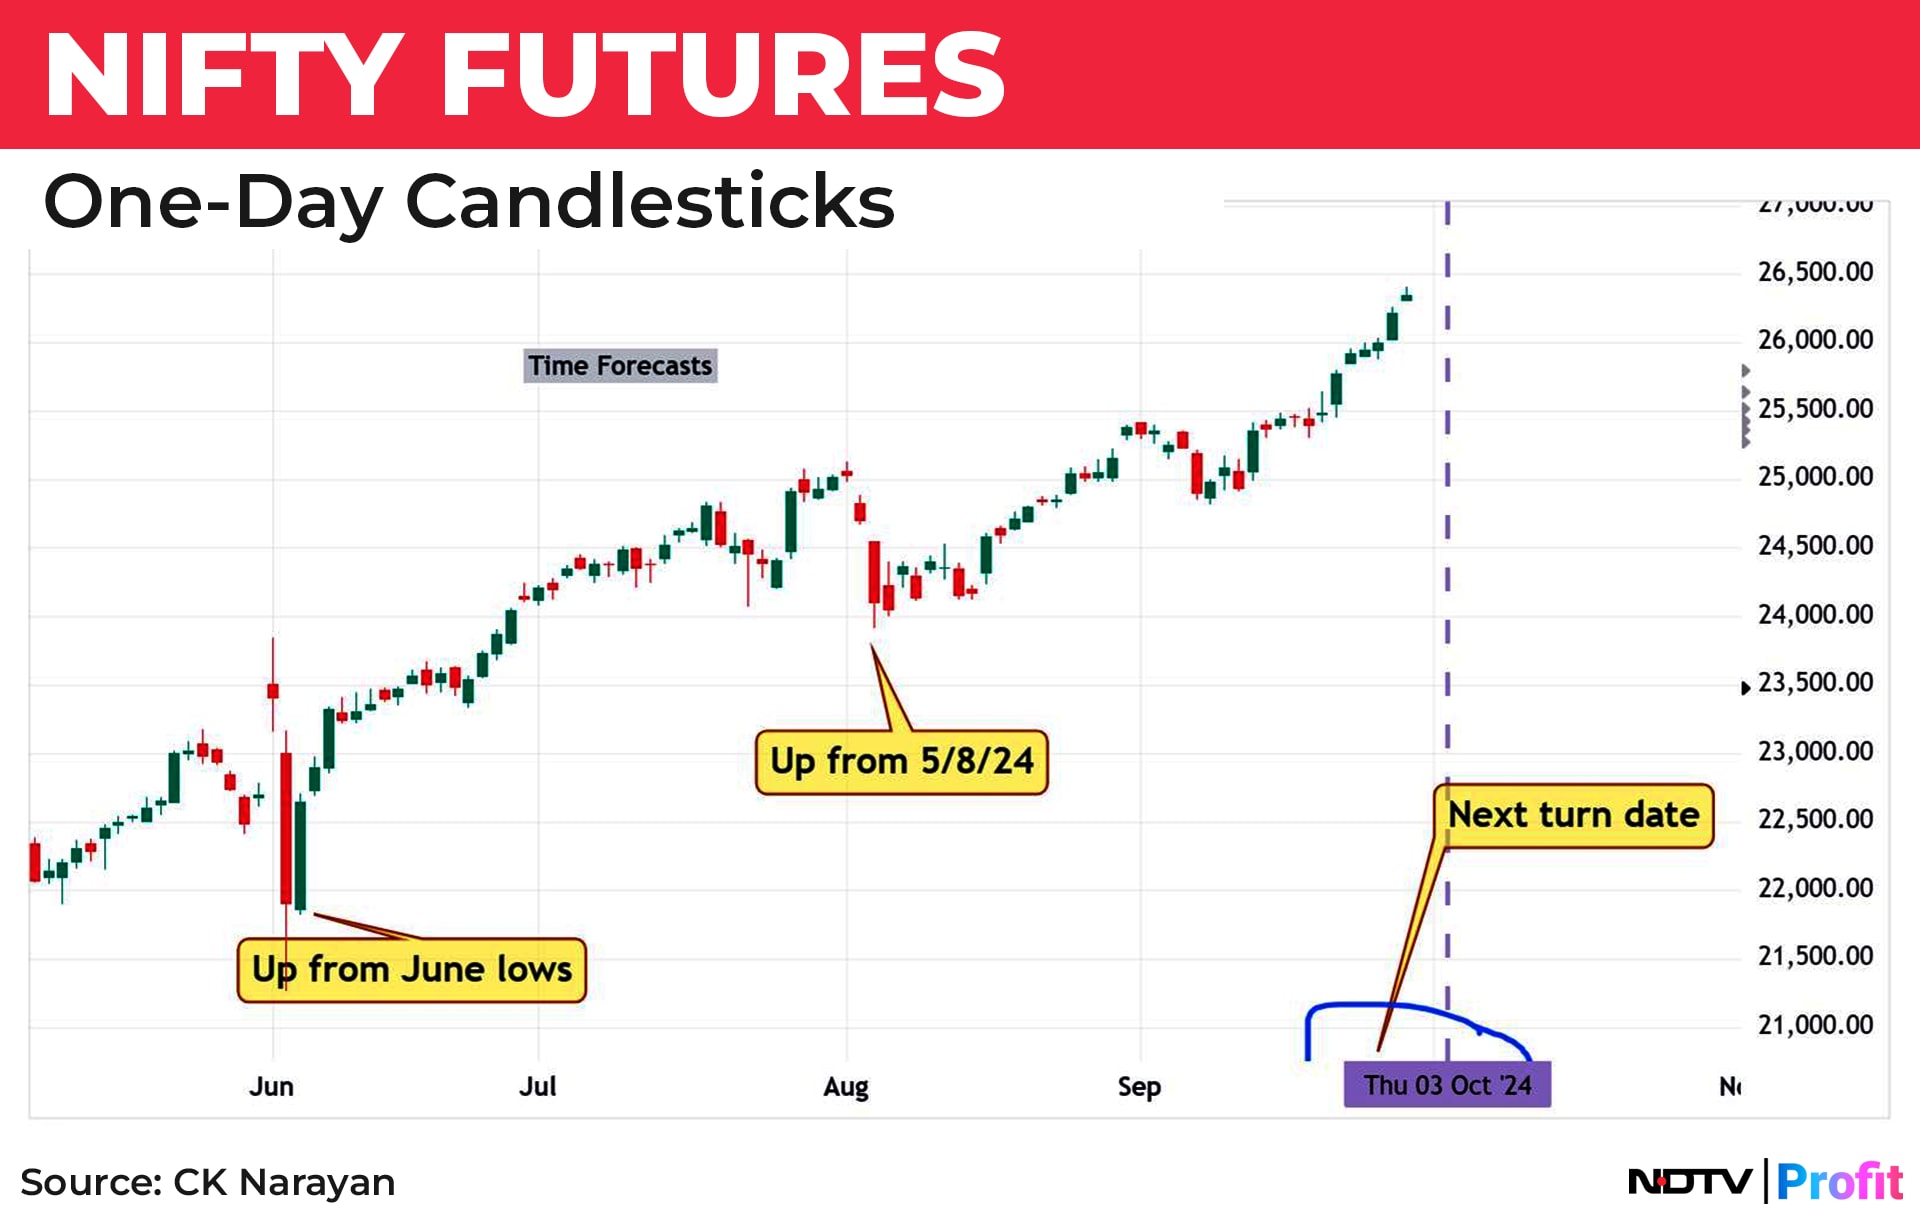
This chart showed that the market could turn from Oct. 3, and since a price pattern of a high had already formed, the chances are that we would go lower. Soon thereafter (in the next couple of days, actually), the NF formed an evening star pattern at the top, and exactly on the 3rd, prices fell with a gap and have not recovered since! So, we had a perfect price (trading into the projected target zone), pattern (evening star), and time (Oct. 3). Now, chart 2 shows the aftermath, with fresh annotations.
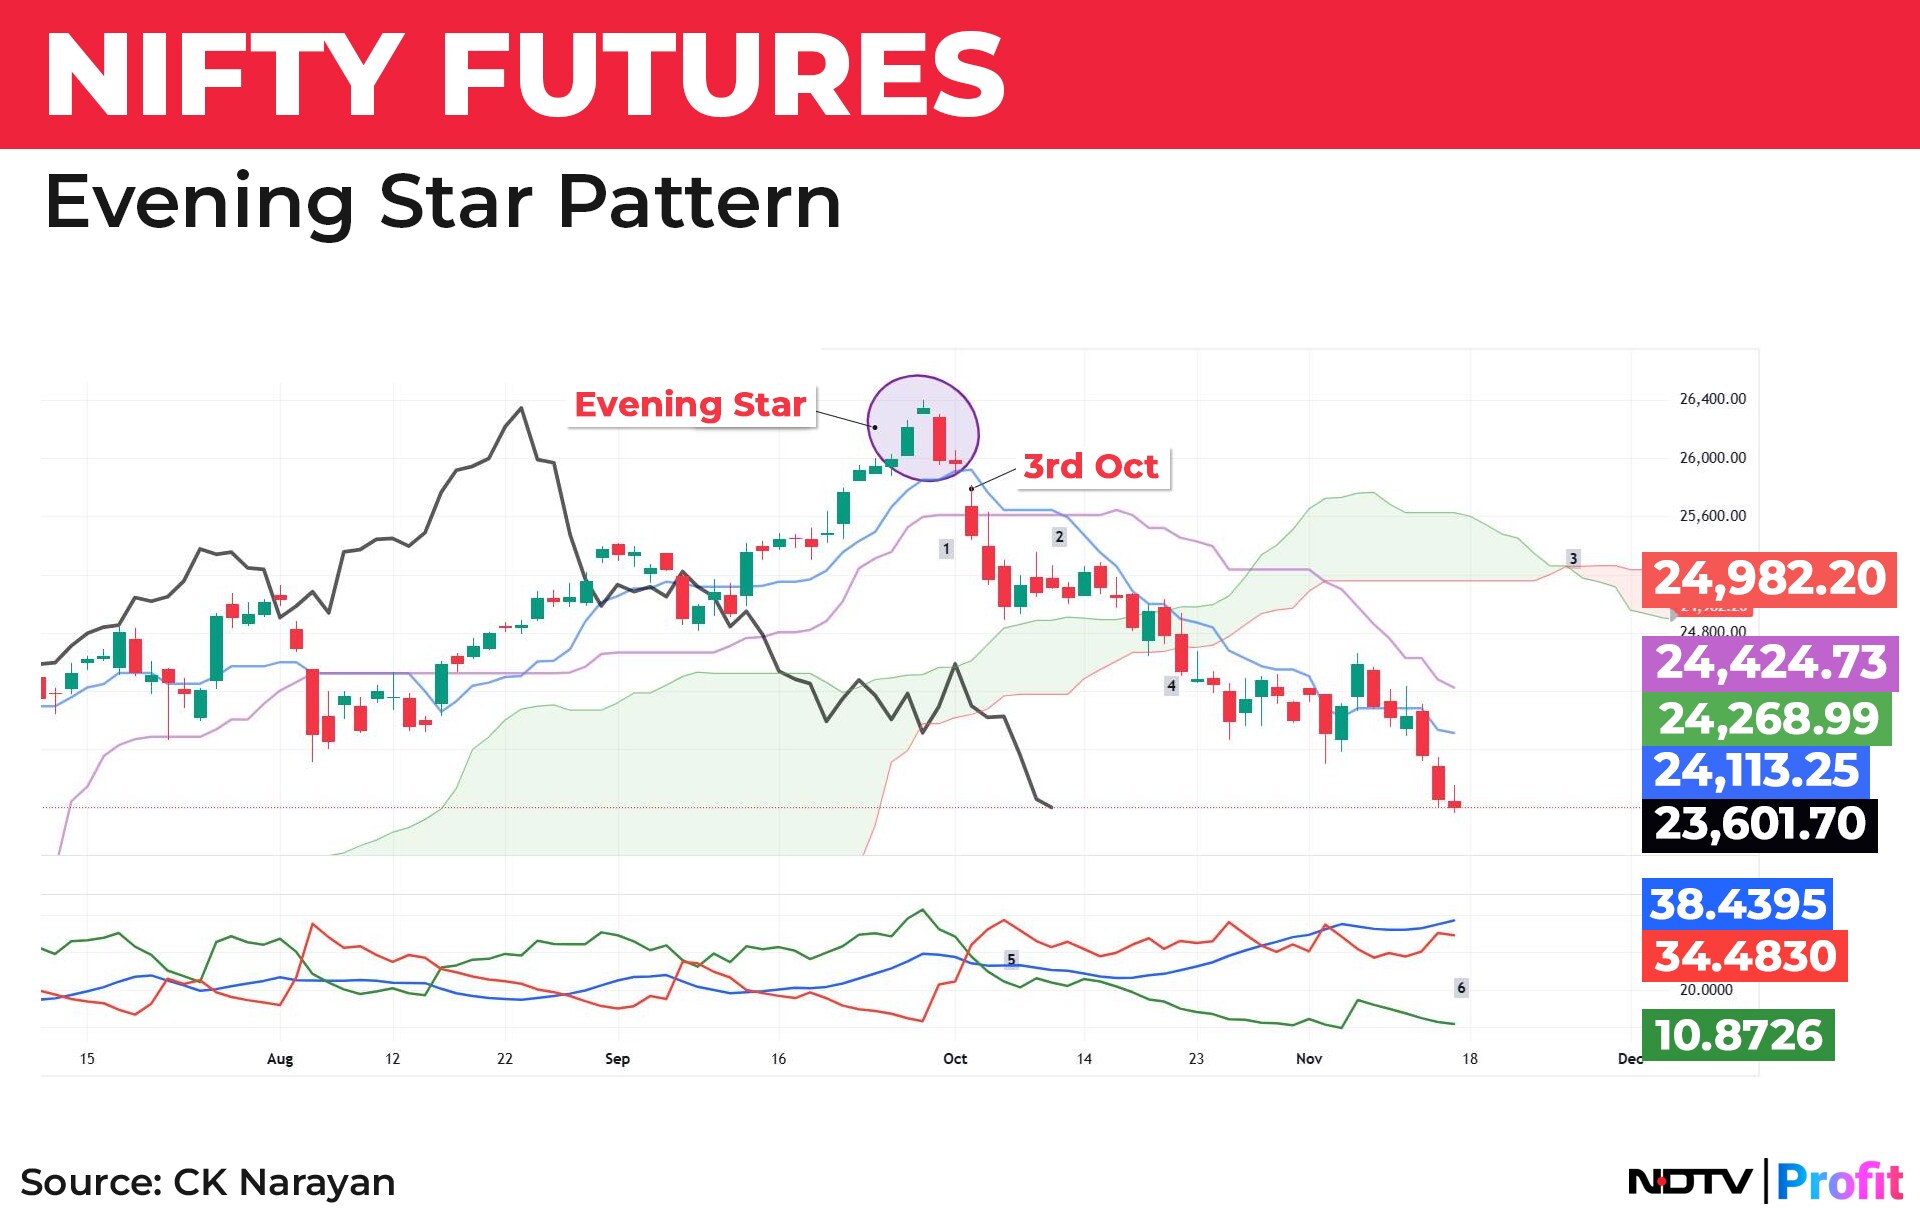
I have marked out the evening star and the start date of the decline (Oct. 3). Now note the markings of 1 through 5 to highlight the changes as they happened.
Number one is the price action of the 3rd—a red candle that breaks the two short-term Ichimoku lines, the tS and the KS, signalling a turn. Number two is the cut of the TS over the KS, confirming the intent to decline. Number three is the future Kumo turn, once again confirming the turn down. Number four is the price break below the cloud, yet another confirmation of the turn. Number five down in the indicator chart, showing a bearish crossover of the DI lines, is yet another confirmation that momentum too has turned.
So, you had multiple confirmations after the projected event for anyone to see that the market was following through on its signals. Technical analysis signals are often ahead of the event or a bit delayed, but they will not fail you if something bigger is going to happen.
But we are all creatures of habit, and we tend not to listen. Even when someone is being emphatic about it. Here is what I wrote in the letter of Sept. 27. “Now, some decisions are to be made. For those following the very short-term trend, they may need to consider taking some profits in light of the upcoming price and time match. Ideal is to wait for the event and then check whether the low of the turn date is broken. Up to the 4th is also fine. If it breaks, then profit taking should be done.”
Now, I can't get more specific than that! If you followed the advice, then you would have reduced trading longs at around 25250 levels. We are making these forecasts, and you are reading it so that you can be ready to act on what is being stated. Else, everything is academic.
Let's go back and visit chart 2 once again. Note now that the lines of the Ichimoku charts are all in a bearish state. There is a point #6 that is marked on the DMI chart panel, and this alludes to the current status of momentum. The two DI lines are still apart, and the ADX is still on the rise (although it has now risen above both DI lines). So, the action is still not signaling any turns yet. Even if there were to be one, it may be a small oversold pop, as the RSI (not shown in the chart) has now hit the oversold area at 30 levels.
The bearish status of the Ichimoku lines will take much doing by the prices before they can move out of bearish and then build something bullish. So, we have a long haul ahead of us. Writing in the last letter, I mentioned, “That is not until Feb. 25. So, expect some ranging ahead now for a few months. This calls for a change in trading and investing strategies. While we work these out, there may be losses incurred. Readers are warned to provide for some setbacks in their working owing to this uncertainty.”
So, gird up for this. This means looking beyond the day's moves and at the bigger picture to plan how to approach. Doubtless, there are going to be upside pops every now and then, some of which may be 2-3 days long while others could extend to 5-9 days too, and these may look like we are done with the decline and the uptrend has resumed. The reason for harping on the Ichimoku signals is for that reason only: do not get taken in by media noise. Let the market do the talking—the charts will capture it. Be confident of that.
Now, what are the changed strategies to follow? At times like these, the tactics for different types of players shall differ markedly. For active traders, the market is oversold and should soon produce a pop. A few have been shorting, but many are still trying to buy the dip. Those that bought lost. It didn't matter what they bought or why—chances are that they ended in loss because the force of the trend was too strong. But with most names underwater right now, to begin shorting may not be a good idea. They should wait for a pop-up near resistance (to be defined actively) and then seek to short. Subscribers to our Neotrader software service will get clued into when that turn is happening as it excels in catching and staying with turns. The multiday trade pages (see image below) have been showing 'short' trades since the October decline started. What is shown here is just one of the many, many pages that carry such trade recommendations.
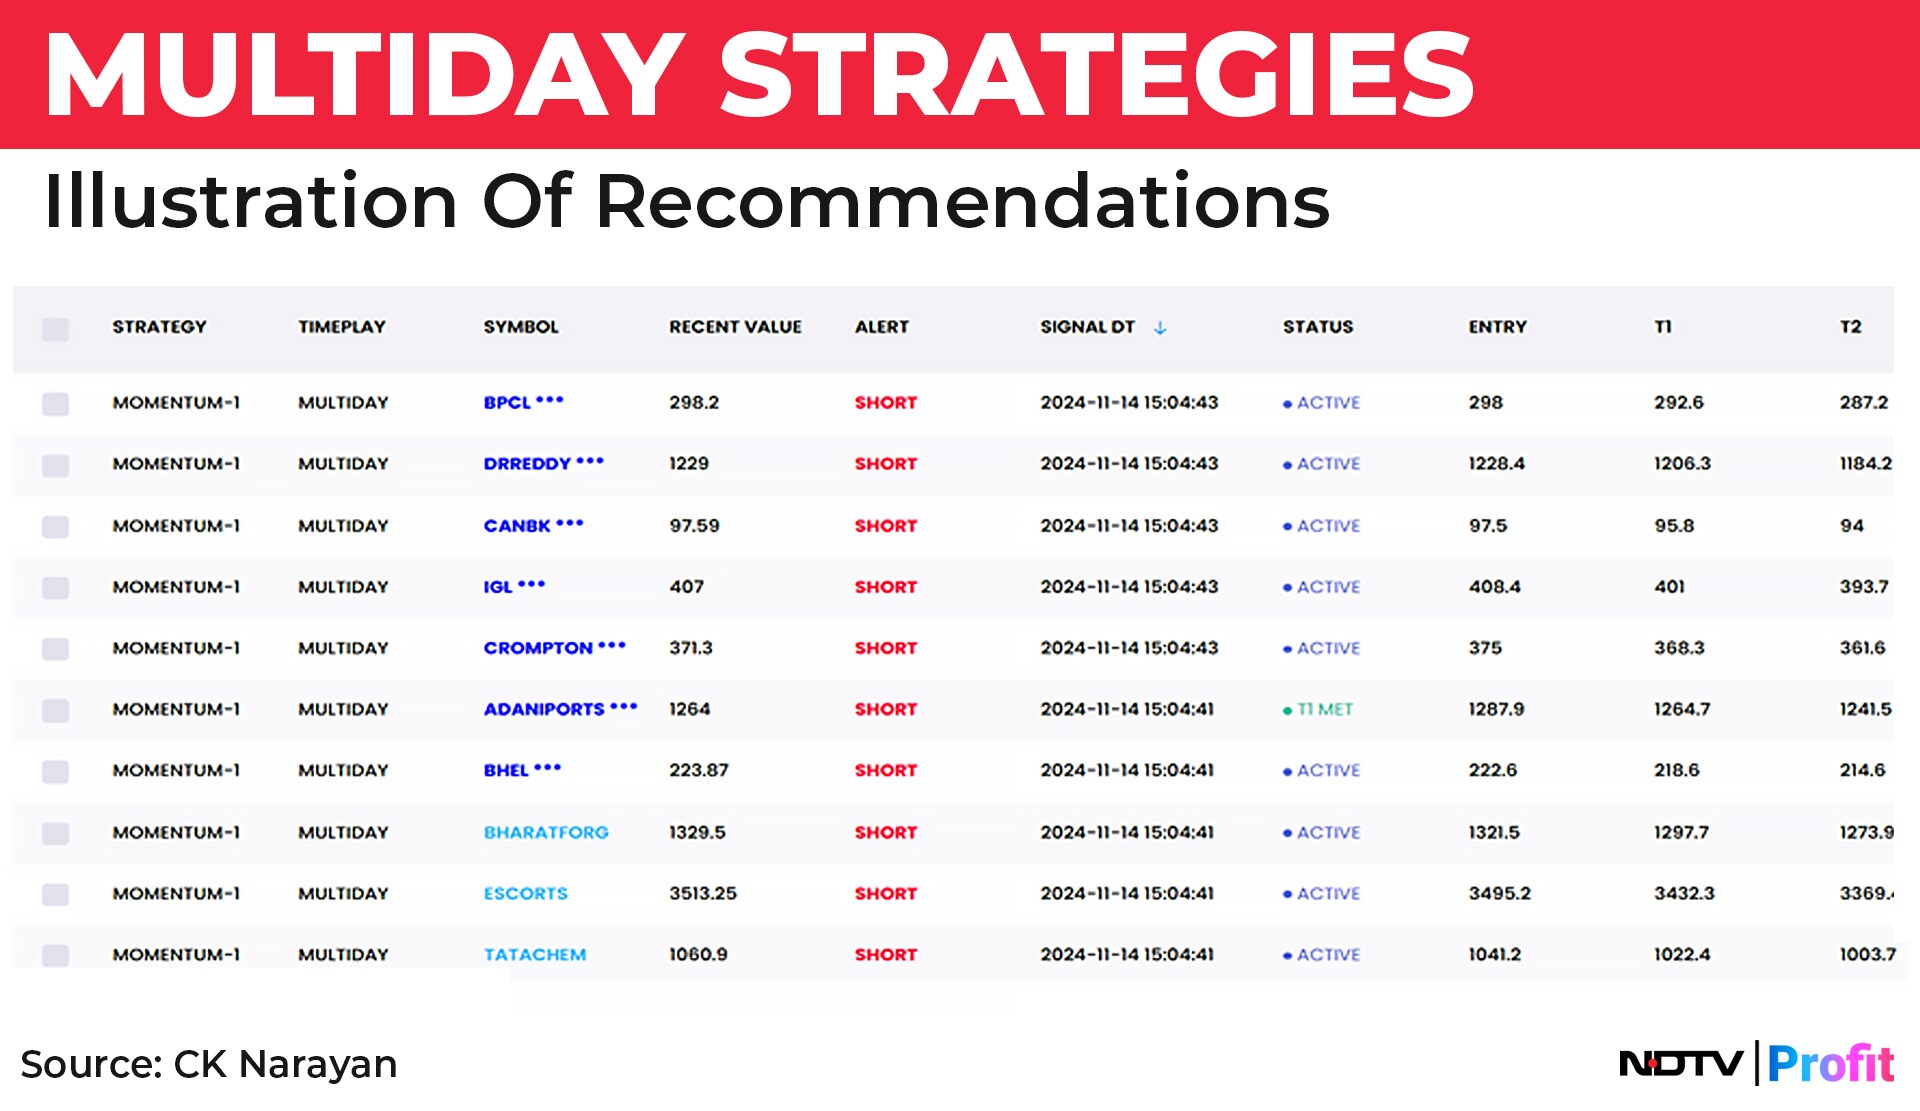
Understand that it is very difficult to handle your psyche when a movement is sustained. We have now been falling for about a month and a half! In the background of the big rise preceding this fall, every low level would have seemed like a bottom! But as we saw in the charts earlier, the setup is still not confirming that! At such times, the value of an unemotional, technology-based tool like Neotrader can keep you on the path. We need every tool that can help us fight our own psyche!
So, active traders can long oversold pops but be quick to take those trades off because bear phase rallies are usually swift. If they extend beyond 3 swift days, then they generally tend to slow down and extend till the 7th or even the 9th day. Take positions off there for sure.
For those who are more relaxed in their approach, they can follow a similar path but prefer to short the end of a rally rather than chance their hands with a long of an oversold pop. Look for some definite reasons (chart patterns or news flow that elicits the expected response from the market or big order flows, etc.) before taking the trade.
Investors have been hard hit in this fall. Even if your portfolio had good stocks, it may still be down 15-20% at the minimum. This is to be expected when indices slide 10% plus. So don't beat yourself up about it. Lesser quality stocks would have fallen up to 30-40%. Those are the ones to get rid of when the market rallies and they reach levels where the losses are affordable to take them. Adding to portfolios is for those who have additional fund flows. They can look at winners of Q2 results (there are several, actually), but that requires some work to gather those names. You will have to do that, but there are many sources shortlisting them for you on YouTube and other channels. Go through those and add in tranches. If we are expecting a ranging to occur across the coming few months, there may be several opportunities to add.
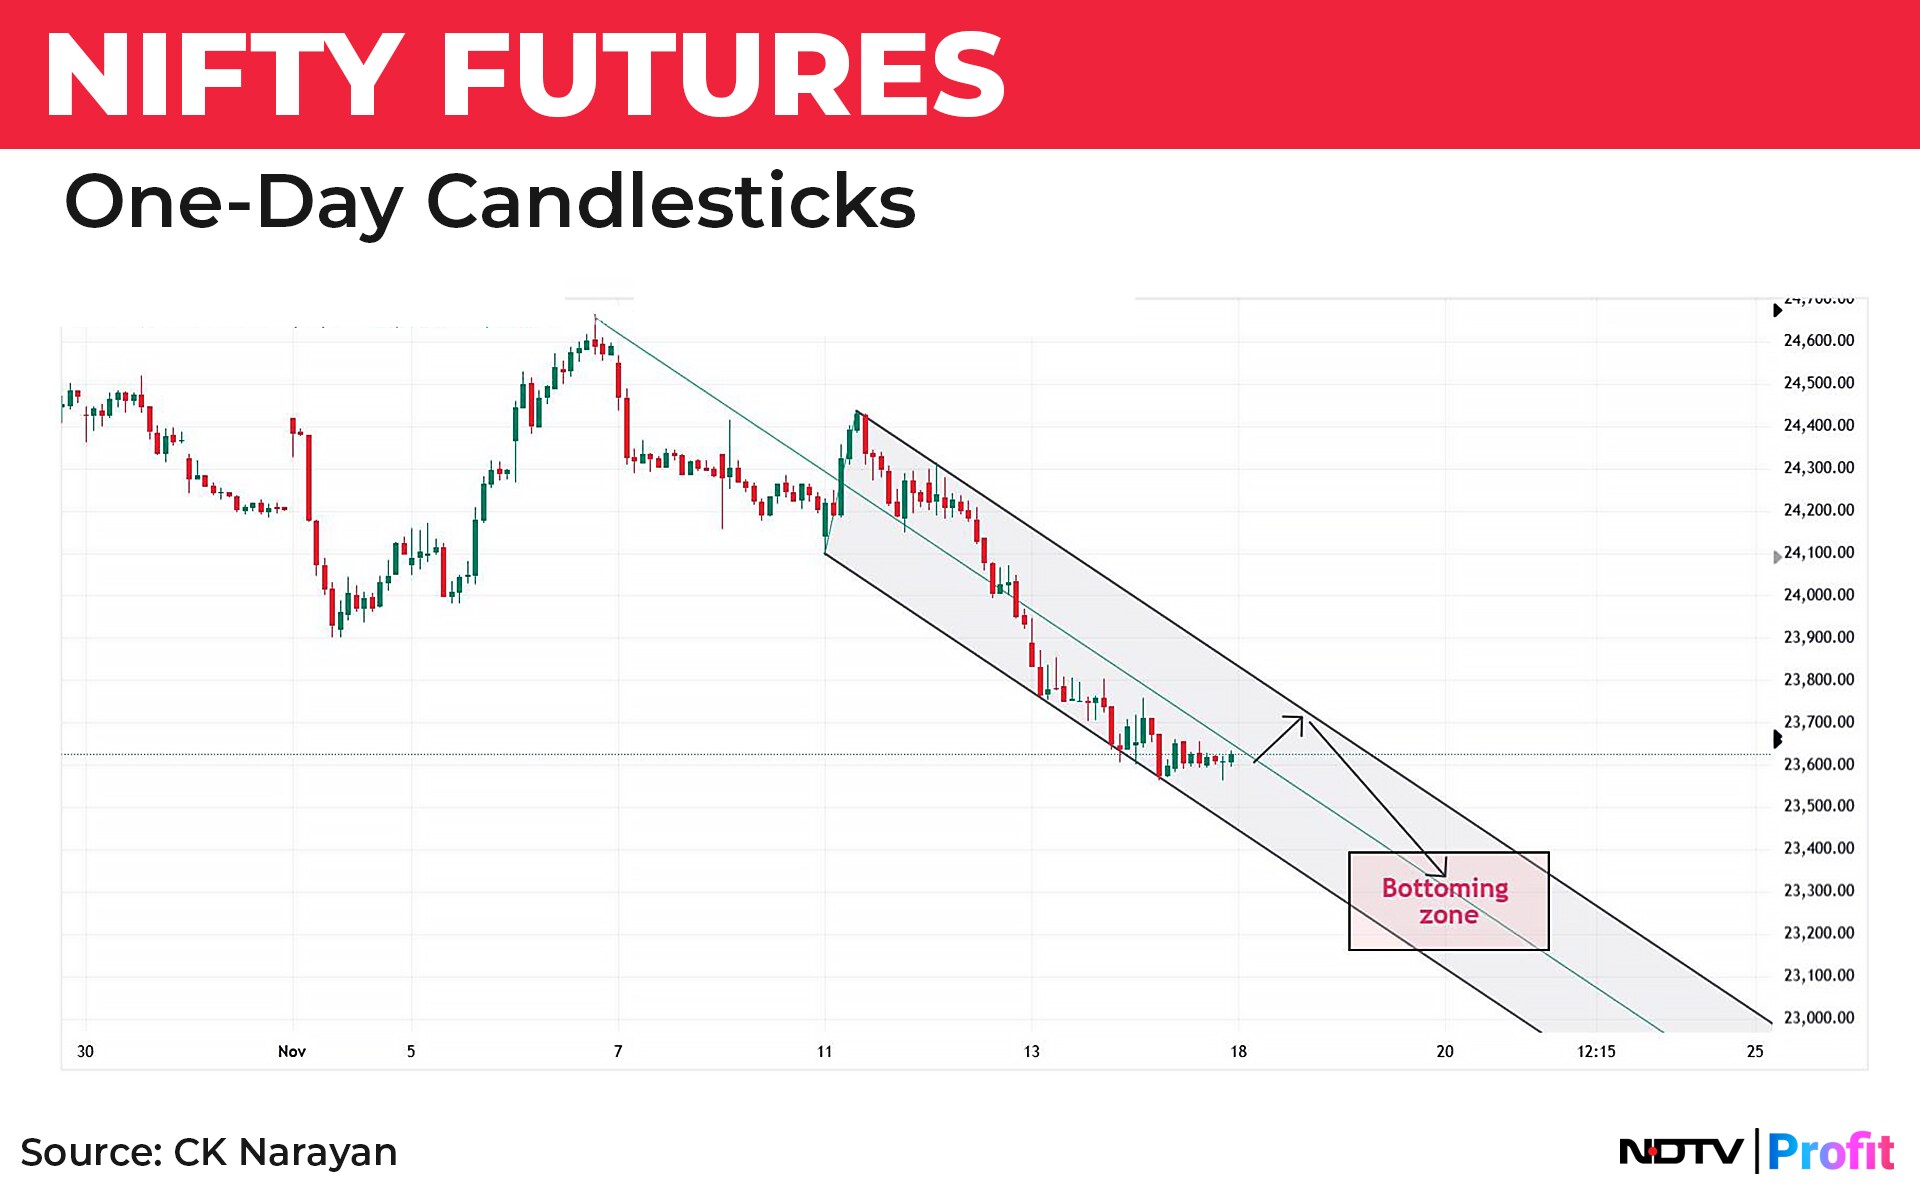
With the 50% level and the 200 DMA breached, the next support zone to look for would be the 23215 area, being a 61.8% retracement of the rise from the June 4 bottom. The next immediate turn date is in the 19/21 Nov window (20 being a holiday). So, if we get a price and time match there, it would be a good point to look and plan for an oversold pop. The move may be something along these lines in Chart 3. The pathway anticipates a mild upside pop and a slide into the price and time window.
Summing up, message is to tread carefully, heeding the advice given for different types of traders and players. Wait for some clarity for levels to reach or for new patterns to form. The market is still very much going to be around. We need to ensure that we too are around.
CK Narayan is an expert in technical analysis, the founder of Growth Avenues, Chartadvise, and NeoTrader, and the chief investment officer of Plus Delta Portfolios.
The views expressed here are those of the author, and do not necessarily represent the views of NDTV Profit or its editorial team.
Essential Business Intelligence, Continuous LIVE TV, Sharp Market Insights, Practical Personal Finance Advice and Latest Stories — On NDTV Profit.


