


It was looking like a quiet week, one that saw some volatility occur but stocks performed on a very selective way. Until Friday. On that day, a combination of positive advices from the U.S. markets, IT majors results coming in not as bad as expected and Reliance Industries Ltd. giving it the charge triggered a whole lot of call option shorts and sent the Nifty soaring again, to finish near the gateway to 22,000 once again.
On a closing basis, we hit a new high close, so there ought to be more coming up. We went away for the week with a good cheer as the good times, they just seem to keep on rolling. While rummaging around in my computer, I found an image that I had displayed a long time ago, highlighting some levels as stoploss for investors. I updated that chart and present it here as Chart 1 for this week. For better visualisation, I have converted the chart to a line chart, so that some levels can be identified.
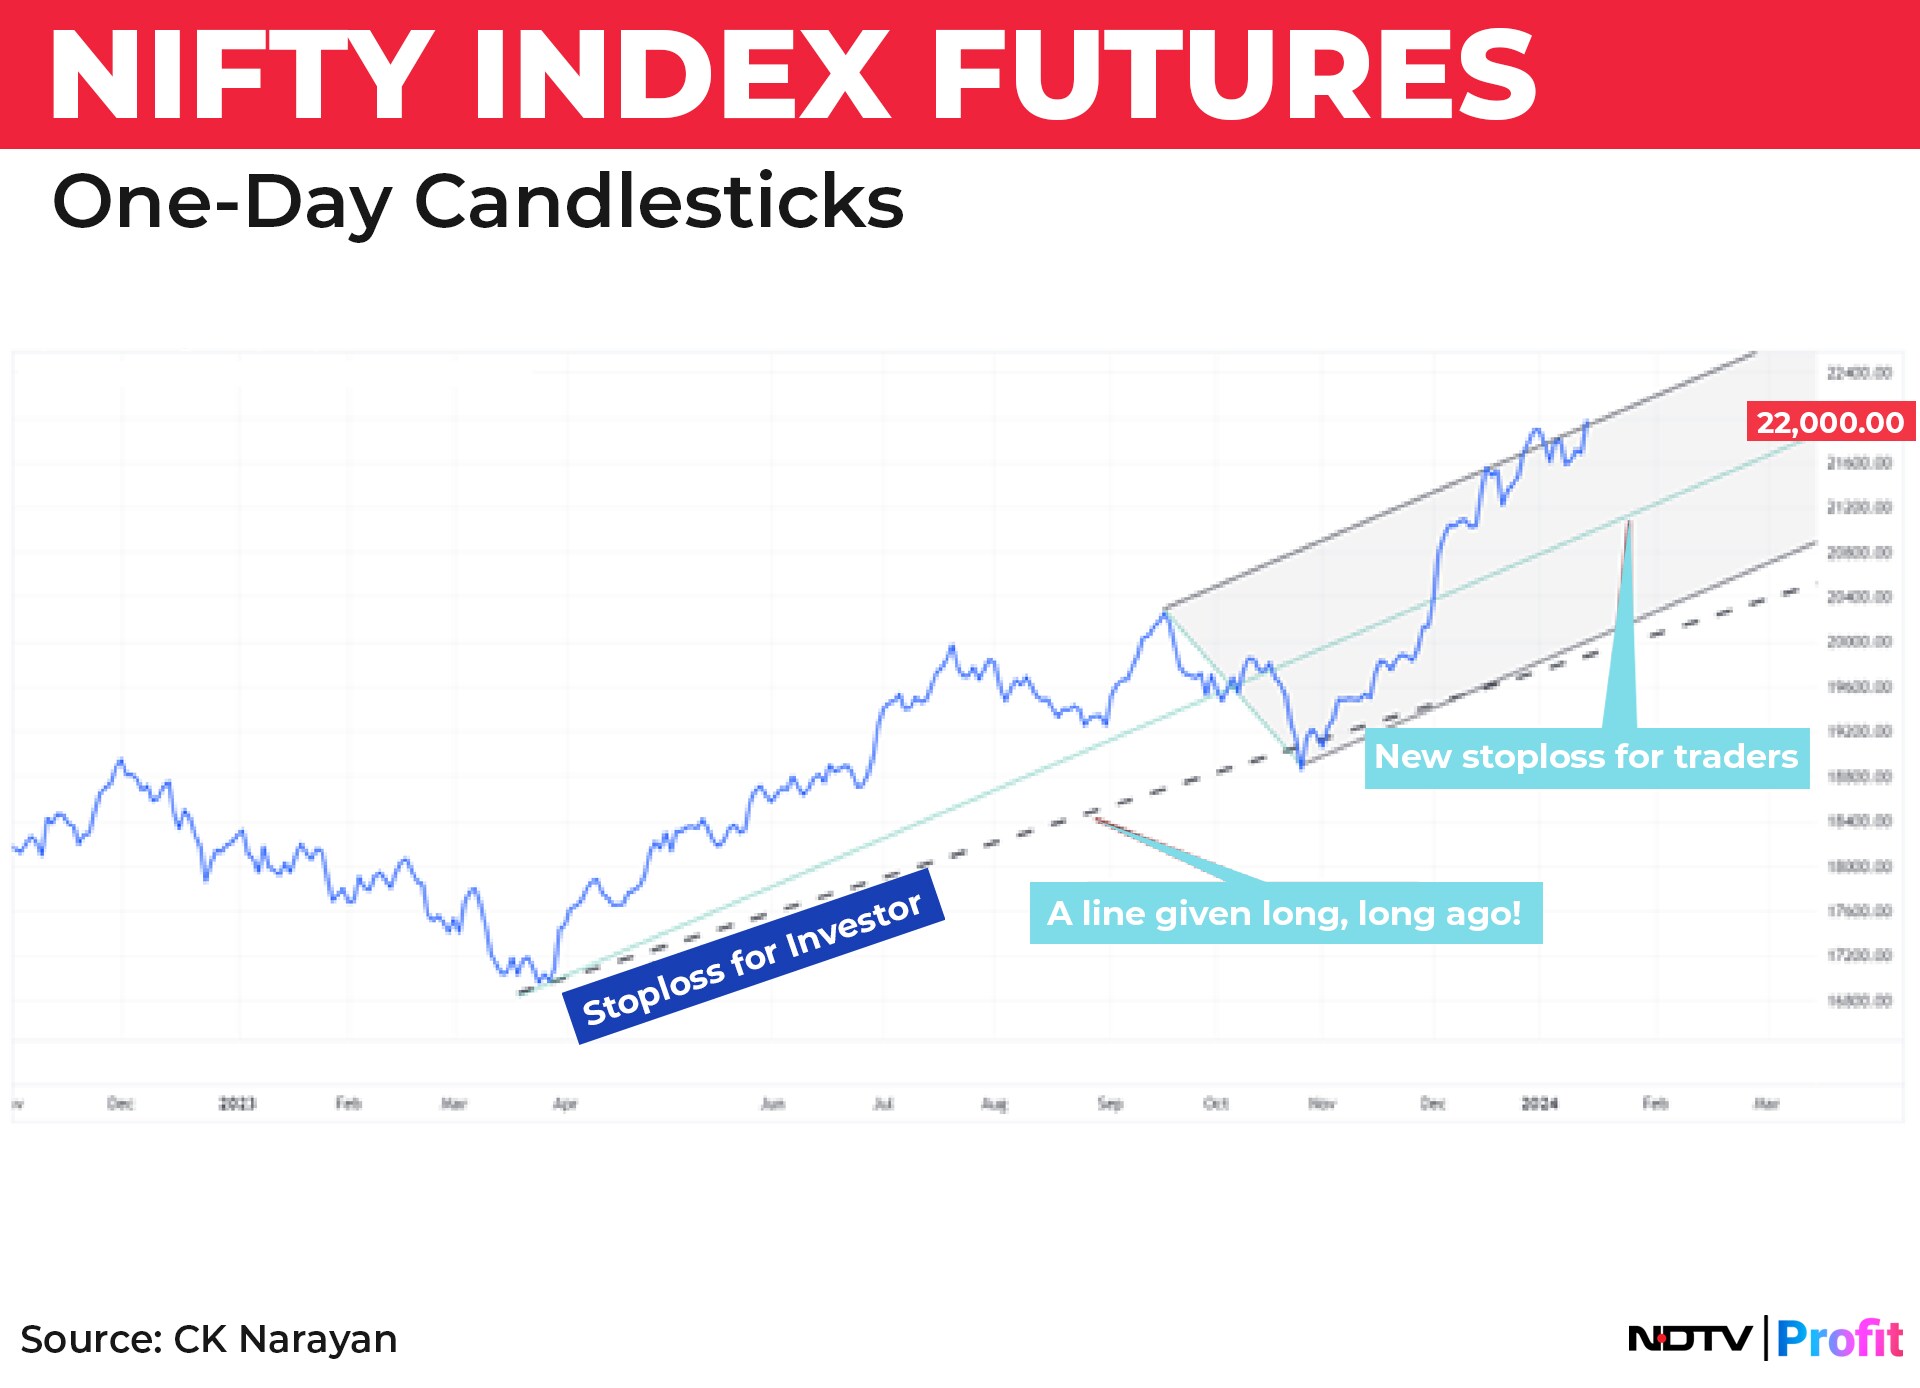
The line titled ‘Stoploss for Investor' managed to hold the sharp decline of Oct. 23, from where the Nifty future has had an almost continuous advance. Many times, simple techniques are all that is required to play the market well. That stoploss line came up, at a certain Gann angle from the March 23 lows and caught the largest recent dip and stopped it dead in its tracks.
As an update, I have now added a pitchfork to this chart and we note that the prices, as of last week, are all set to cross the upper channel, implying further gains are possible from here too. I have also indicated the median line of this pitchfork as a possible new stoploss for traders. This is currently at 21,050 levels. Note however, that the stoploss for investors continues at the same former stoploss line—which has now worked its way up to 20,000 levels and that this line is quite close to the lower channel of the pitchfork too, making it a decent cluster.
I had used the 1-bar swing chart of Gann to define a swing low support in the last couple of letters. It remains undisturbed as yet and the last week's limited price action could only create a near-term swing low at 21,501, while the second swing behind continues to remain at 21,060. Remember that based on this method, we use two swing lows behind as a trailing stop. Now, note above that the median line of the pitchfork is also at the same level. So, traders should definitely use the 21,000 levels as a short-term trend inflexion point.
Just another word on the pitchfork channel. In a rising channel, it is the break of the lower channel that signals a possible change in the trend. Note in the chart above that the prices are actually crossing the top channel. This tells us that the trend is still quite strong and not really in a mood to reverse.
There are many who are looking at valuations and opine that the market is much overbought and that should bring about a meaningful correction. But that is a limited view of the market, because a 360-degree of the market should involve valuation along with the levels of liquidity present in the market as well as how strong the ruling sentiment is. The sentiment decides how much of risk people will take or not take. The liquidity factor will ensure how far the prices shall fall during a reaction.
Right now, while one of the factors (valuation) may be getting stretched, we are all aware that the liquidity pouring into the market is immense and there is continued growing risk-on sentiment still. Thus, only one part of the market may be off and that too may mitigate if the expected growth ahead in 2024 comes through. No wonder the market trends continue to plough ahead.
Let's take a look at the momentum factor. Chart 2 shows the weekly chart with the RSI. Straight off, we can note that the indicator is still ensconced in the overbought region. So, no signs of trouble yet. Some stalling, perhaps, but that is not a reversal signal.
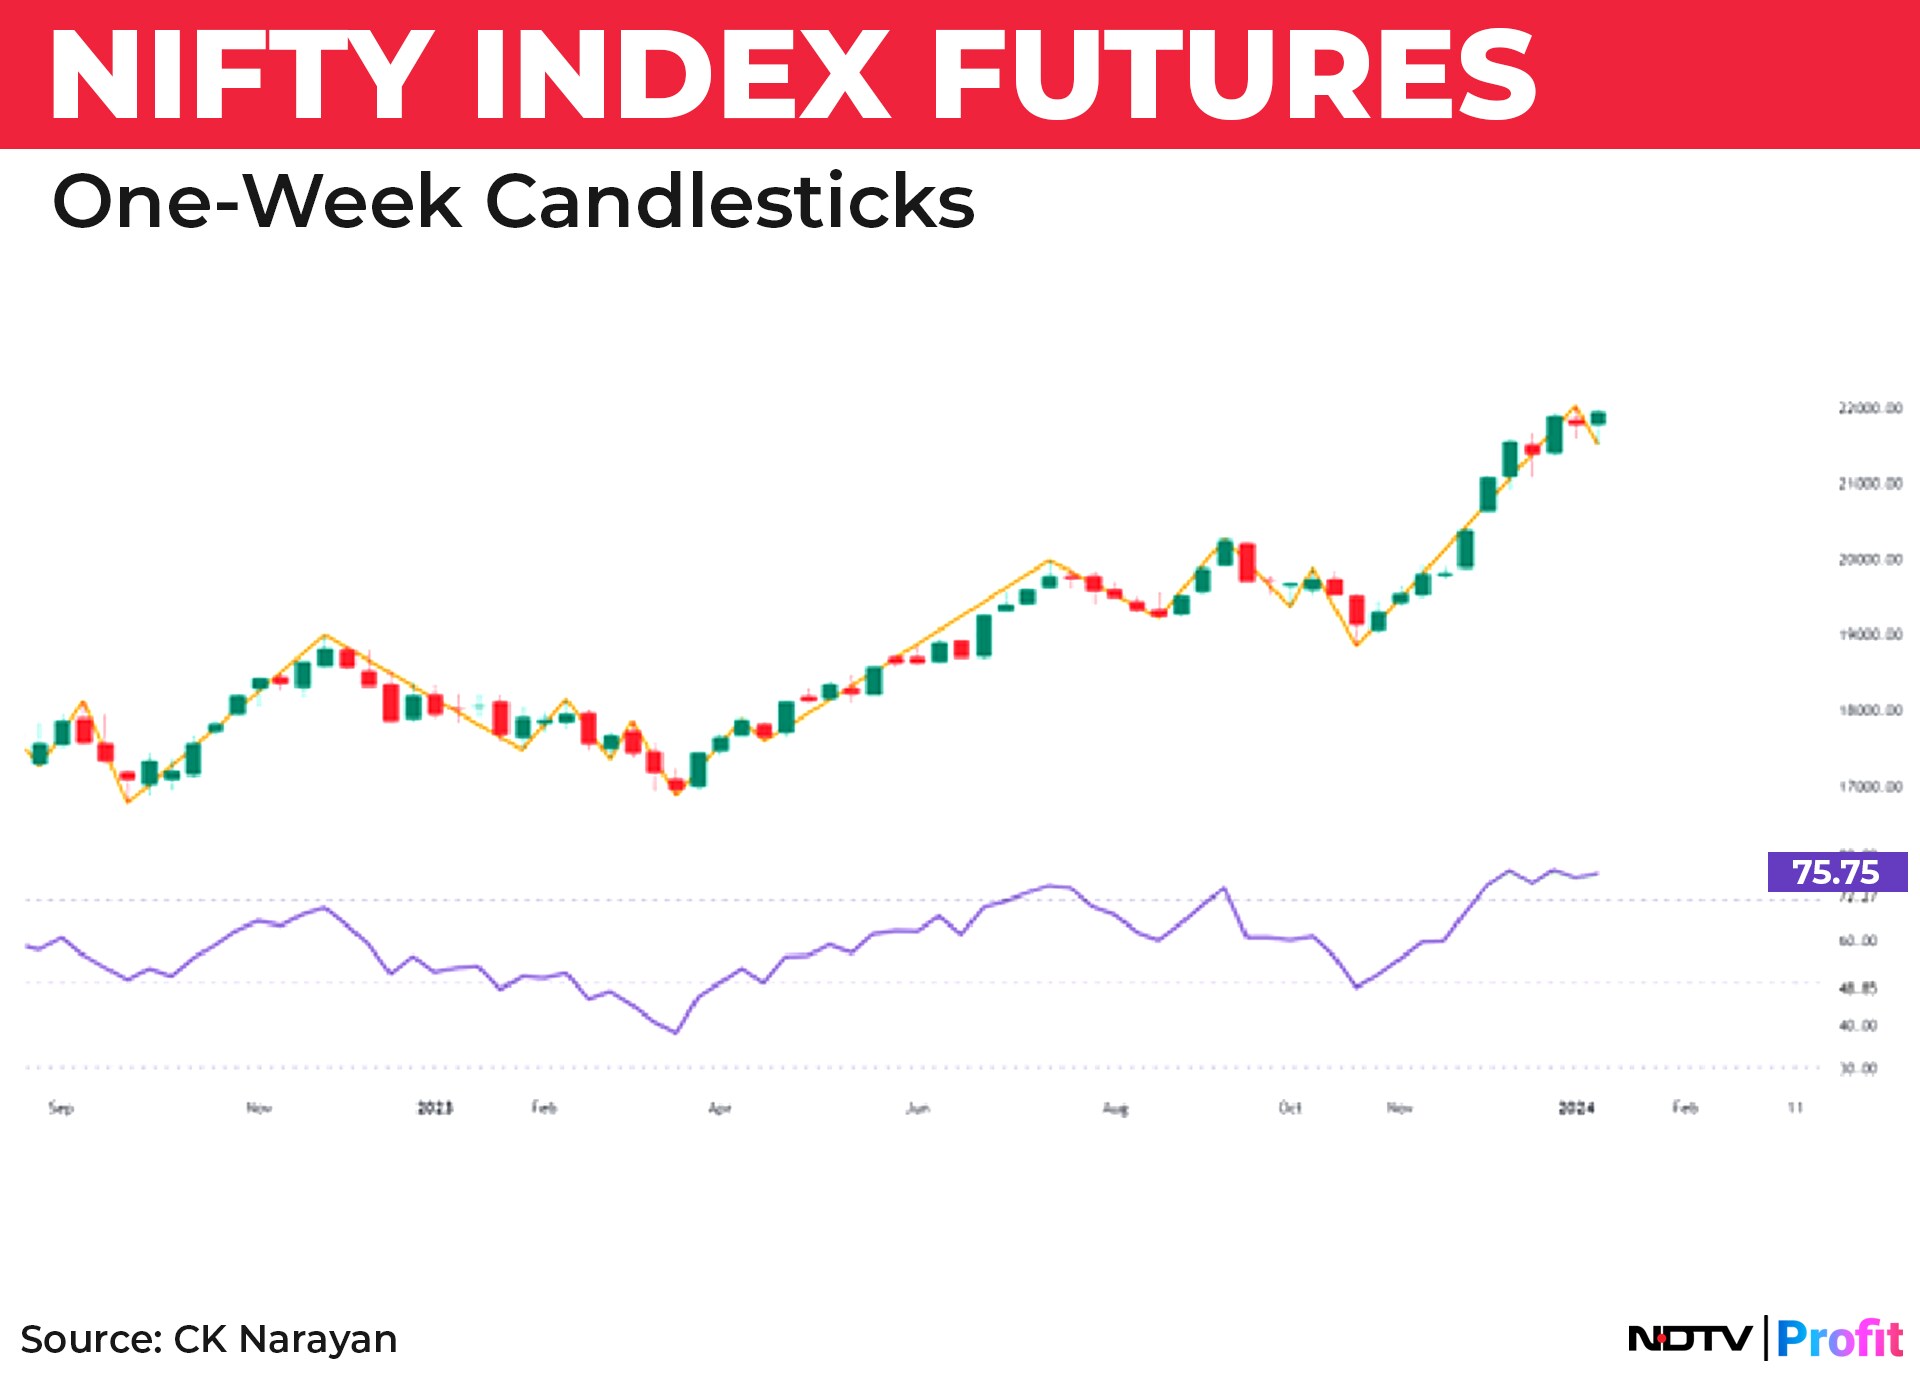
Notable also in Chart 2 is the same Gann 1-bar swing but on weekly charts. Note how there is no disturbance in the trends. The fact that I had mentioned in earlier letters—of how the earlier week low was not being broken for three months—is still visible. So, momentum-wise too, there is no alarms raised yet.
And now for some red (or amber?) flags for the back of our minds.
In my earlier letter, I had mentioned that in the period of Dec. 31 to Jan. 15, the market is entering a period of topping action. I had also mentioned that, owing to the high momentum and strong sentiment, the topping action would get spread out. I reckon that is what is in progress. The move of market leaders towards the end of the week is probably setting the stage for some softening to develop. A small observation is shown in Chart 3.
This shows the Nifty from 2014 till now. The arrows are showing the budget as an event. If you notice, there is a certain regularity about the market moves vis-à-vis the budget. We can almost see that there is a regular alternation after every budget (except in 2017). Take a look at the chart.
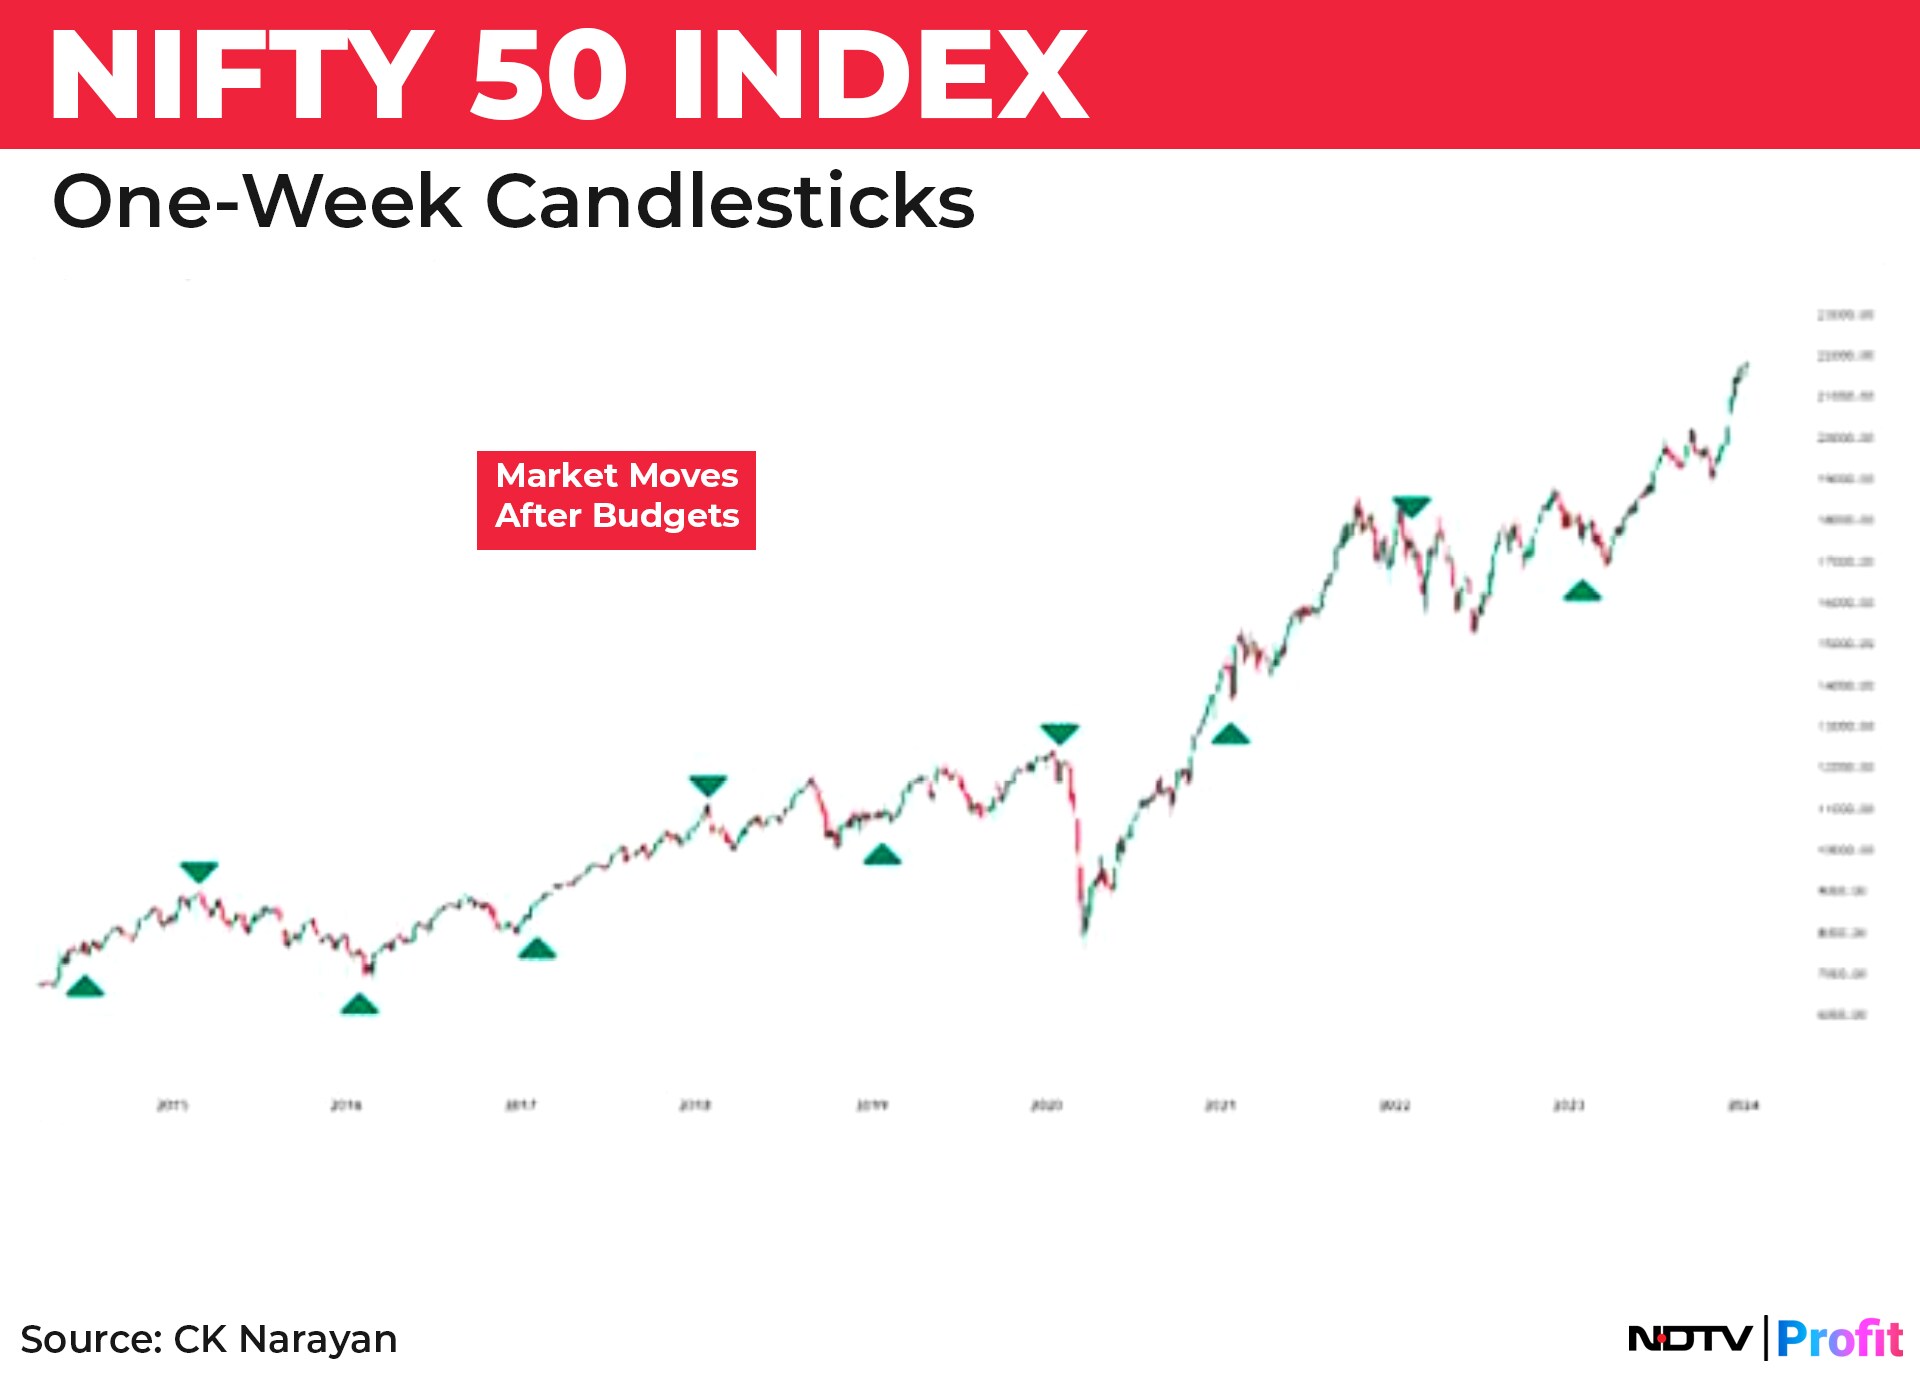
The market went up big time after the 2023 budget. Now, it may be time for a down move, using the habit of alternation.
Now, this is tricky, as 2024 will have two budget sessions. One in February (vote on account) and then, a regular one post the election in June-July. Given the current trend, I do believe that some expectations are built into even the Feb. 1 event. Now, my annual projection for 2024 has the market slipping into a reaction (more clearly) from early February. For the June-July period, I have some consolidation expectation.
I feel the current trend may start a downward motion from mid-January that may pick up from early February and take the market into a four to six-week reaction that will satisfy the pullback expectation based on the alternating habit. But the new government budget that may get presented in the middle of the year may provide fresh ammo for the trends again and take the market higher. Let's see how this plays out.
Overall, I would suggest continued participation in the market till the momentum plays itself out. But be alert to not-so-overt signals of a flip-over like good news not propelling trends higher (after numbers now), prices not coming back from reactions (like they used to) or some volume-led declines during reactions (hitherto not seen), etc.
It is a time to watch before diving in. Everyone is playing cautious currently, except the new kids. They just don't know different. It is not surprising that in a age-breakup of people losing money (the 85% bracket that SEBI spoke about), the bigger losers were the older players. They have experienced declines before and they become extra cautious as the markets go higher whereas the trends are carried on just a bit further by the newbies, as they keep responding to every piece of good news and get sucked into some kind of distribution game. As people following some analysis, we should be careful participants with well-defined stops who should continue to play. For sure, some deals at the end will blow up on our face, but if we are alive to the possibility, we won't get burned. We are nearing there, so keep your guard up!
CK Narayan is an expert in technical analysis, the founder of Growth Avenues, Chartadvise, and NeoTrader, and the chief investment officer of Plus Delta Portfolios.
The views expressed here are those of the author and do not necessarily represent the views of NDTV Profit or its editorial team.
Essential Business Intelligence, Continuous LIVE TV, Sharp Market Insights, Practical Personal Finance Advice and Latest Stories — On NDTV Profit.


