At the outset, wishing all our readers a Happy New Samvat Year ahead. The last one has been an excellent one and we look forward to more such years!
The last piece was entitled as ‘Selling is almost done' and that did turn out to be the case as the market dipped a wee bit more and then pulled up into a 750-point rally into last week. But towards the end of the week, it seems to have given up some of that effort and raised the bogey of continued declines ahead. To know the answer to query, we have to see the fledgling rally in more detail to see its true characteristics. Chart 1 covers some of the important points of what has happened so far.
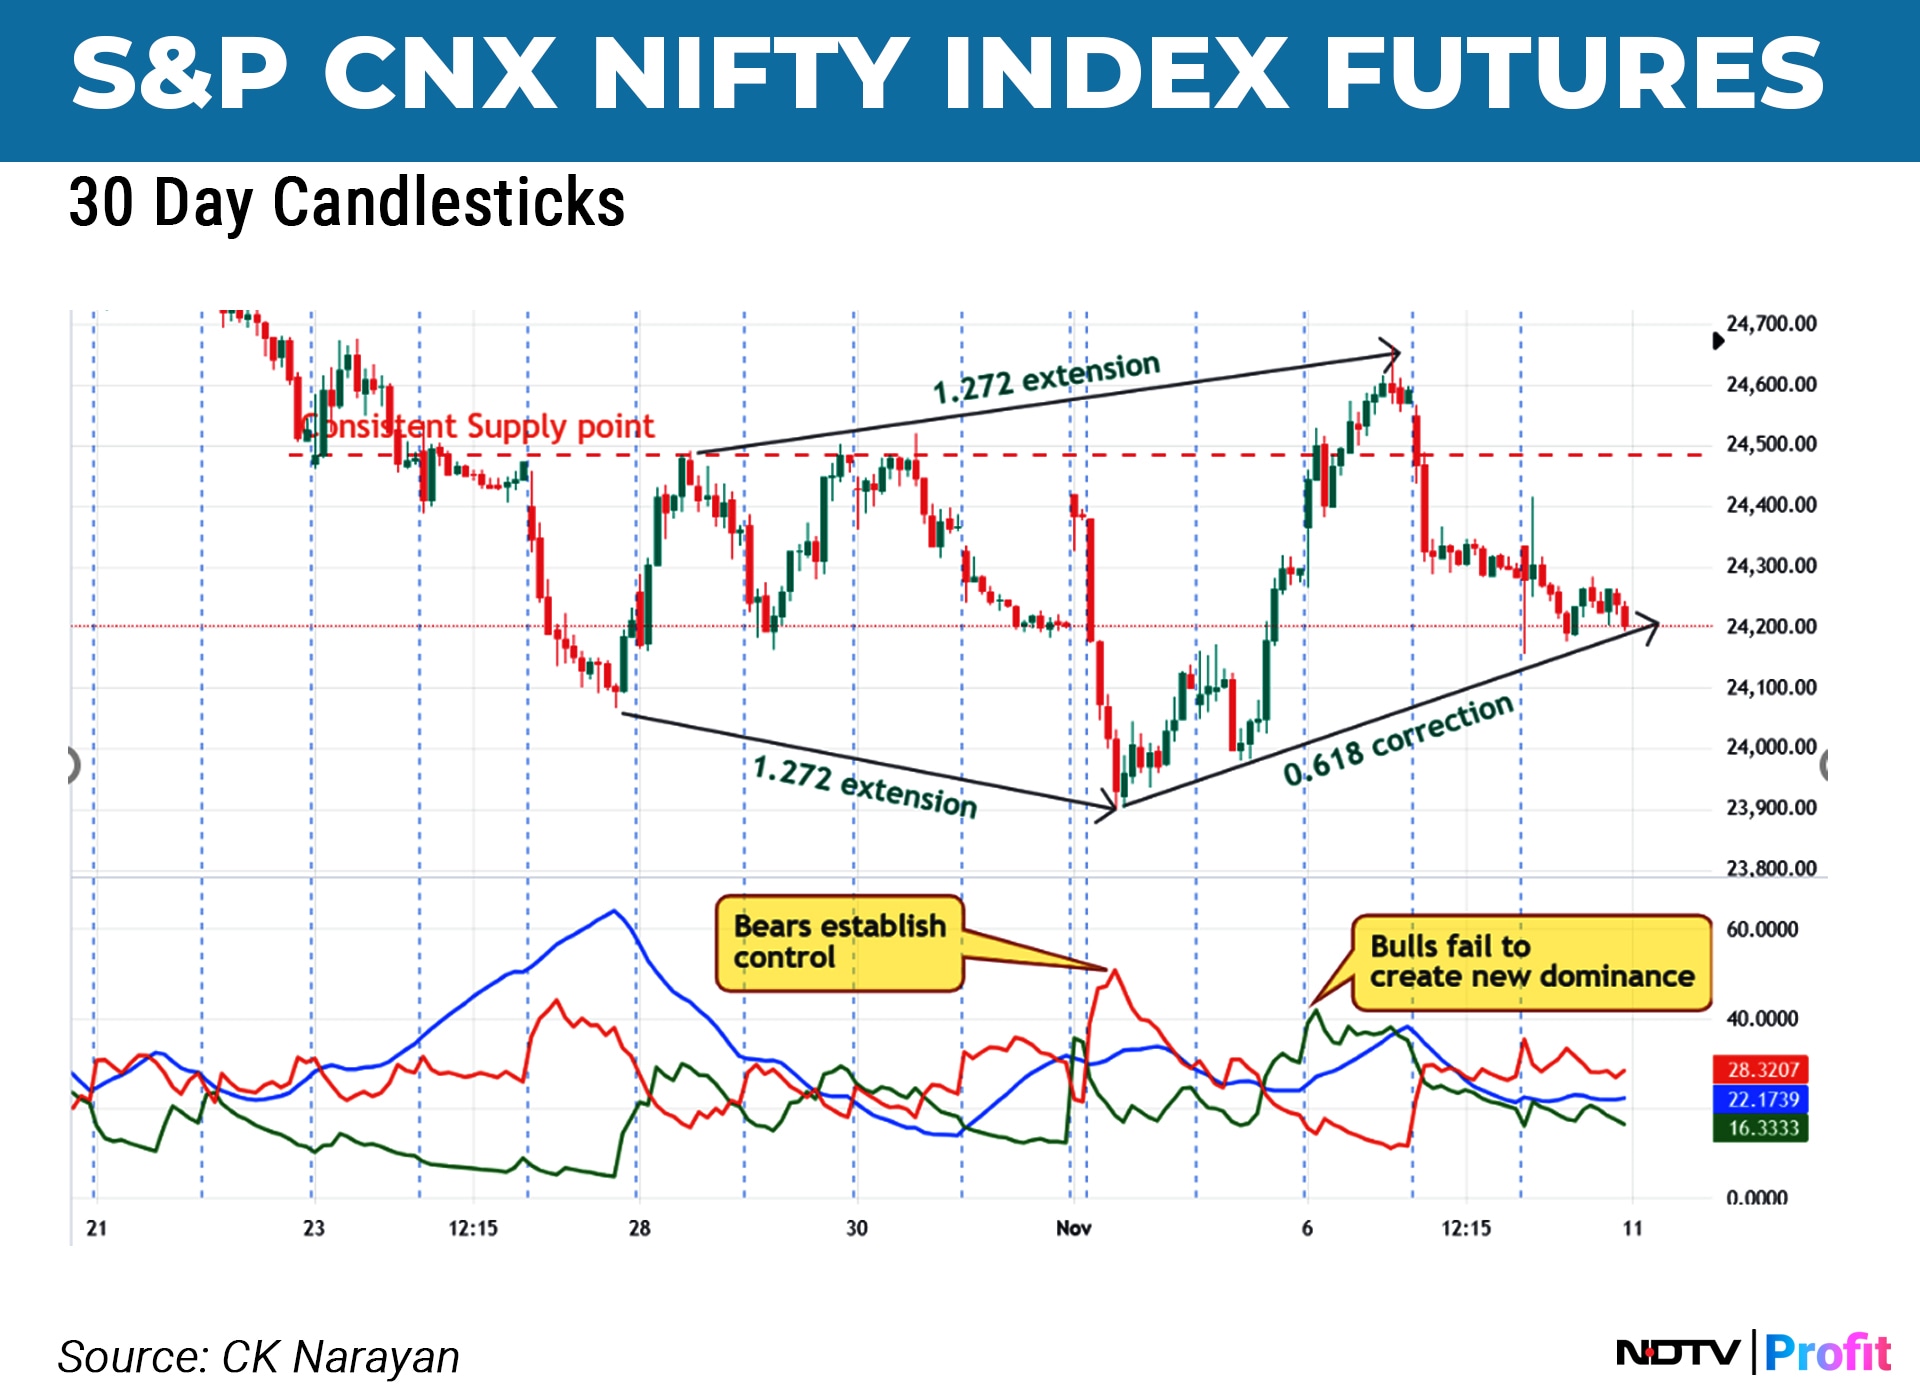
In the earlier week, the fall continued some, creating a low at 23900, which was a 1.272 reverse extension of the prior corrective leg. That point happened to be a precise price and time match in the very short term—something that I highlighted (and tweeted) in my daily advisory column (free) on my website www.cknarayan.com under the Insight column. Since we also had a pattern match at that time, the rally set in for the next 2-3 days.
Interestingly, the prices once again did a perfect 1.272 reverse extension of the prior decline to hit 24665 in about 3 days. This was another price and time match for intraday charts, as corrective rallies in fast-moving markets typically move 2.5–3 days against the trend. It rarely matters what is the reason behind such rallies, for they always appear. This time it was the US elections. But soon after the results, the market, instead of continuing higher as expected by most, turned right around and back into the decline. This has now pulled back to 0.618 of the recent rally. Now, all price moves are in perfect Fibonacci relationships, so we could be in the middle of a possible harmonic pattern in progress. Such patterns will have (usually) two more We can estimate the legs in terms of price and time, but the key takeaway is that the market is likely to remain in a corrective phase for the upcoming week, potentially maintaining a range of 24000-24600, which may unfold during the week ahead. The legs can be estimated in price and time but the main point is that the market is likely to remain in a corrective phase for the coming week as well and a range of 24000-24600 may be maintained.
Another point to note in chart 1 is the ADX setup. In the decline into the Nov. 4 low, the bears continued to maintain the control that they had seized back on Oct. 3. The small rally of last week was quite unable to gather sufficient rally strength to overturn that bearish grip. This means the bearish control on the market continues. With the Trump victory, many were willing to call for the end of bad times but the technical indicators are certainly not in support of such views as of now. Until we have fresh evidence of that, we have to believe that the market is in a sell-rally mode for traders.
As I am often found stating, reaching some support zones or turn points does not automatically tantamount to a rise ensuing. The market can slip into consolidation mode for a while and keep everyone guessing about its intent. I believe that phase is upon us and some highs may break while some lows too will be violated, sending people hither and thither. If we recognise that as a phase, then we can avoid getting whipsawed by the swinging market.
At such times, the best strategy is to trade long at supports and short near resistances. Avoid breakouts, in other words. There isn't sufficient upside momentum to carry the prices higher on a breakout, while the decent fall (9%) may ensure that breakdowns may also not see new momentum develop to the downside.
If that is going to be the tack, then we have to shift focus to price and time matches more on the smaller time frame charts. Chart 2 is the 60-minute chart of the Nifty futures. This measures Time on Hour basis. The updated chart is shown here. Next time count is expected on 20th Nov. We should be looking for price and pattern matches around that date next. This date also matches with a time count I make on the Daily charts, so, a kind of a cluster and hence worthy of watching.
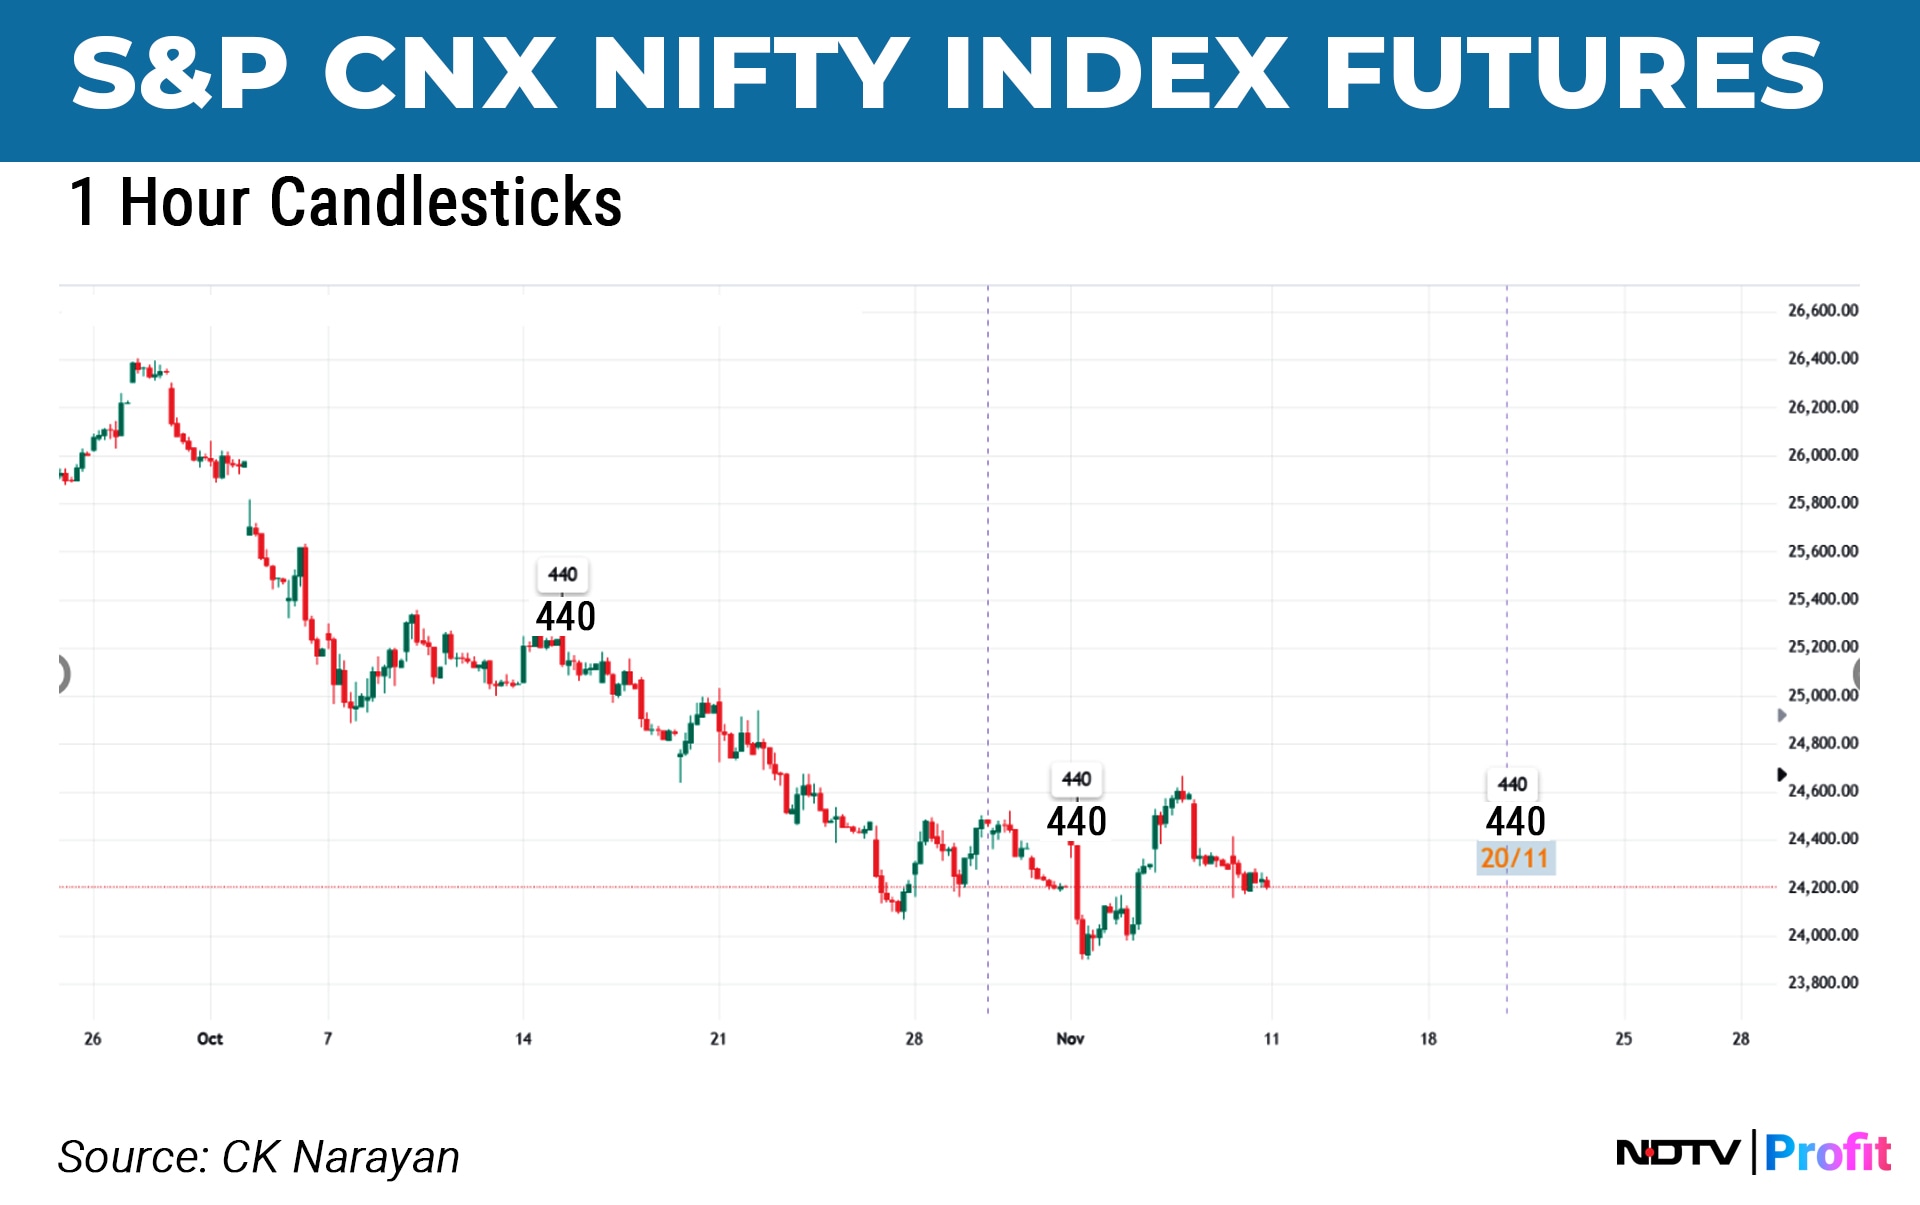
Assuming that the market put in a low recently, the next question to ask would be, is a 750-point rally good enough to correct a 2500-point decline? Usually, countertrend rallies in a trend move to around 38 to 50%. If this has to occur, then we could look for 24840-25140 zone. That is the higher end of rallies to expect for now.
All bullish bets are off if Nifty FX breaks into new lows ahead. Then, the last-week rally (to 23.6% retracement) would reveal higher weakness. If the 1.272 extension pattern is to be maintained, then the next lower target would be 23695. We look for all these price matches next around 20th Nov.
As regards the lower extent of correction, there are varying views currently in the market. As index drops lower, more people join this gang—this is typical of the market sentiments, always. If sentiment has to be graded right now, I would say that in the very short term, inhabited by day traders, the dominant sentiment would be fear. The next level of the market, say active investors and swing traders, is worried. Multiday players are probably in that league as well. Beyond them, the longer-term investors and big swing traders are still sanguine, as the greed factor is not gone away and they are looking for buys in this market. What about the media, which helps sustain and even spread sentiments? I would state that they are confused as they keep looking for convenient news and event pegs to hang the trends on. Since that is swinging wildly, the views of the talking heads too. Their benefit lies in their ability to express so much in a single day that it either drowns out or overshadows everything the next day! Swinging one to another on a day-to-day basis. Their advantage is that they say so much in a day that it all gets drowned or overwritten on the following day! Finally, the fund chaps. Alas, their jobs and the safety of it compels them to be bullish 9/10th of the time. So, for them, every dip is a buying opportunity! Ultimately, the very wide umbrella of ‘the long term' shields them from any storms that may emerge. The man on the street, unfortunately, gets assaulted by these varied sentiment views every day and that net result is more confusion!
The only solution is to develop a mind of your own. It is your responsibility and you cannot duck it. Every now and then a good bull market comes along and releases you from that responsibility. Like, the last 3 years. But then the days and weeks of reckoning—like now—come up without fail, forcing them into taking a position. Those that learn to do it are able to retain or protect what they made during the bull phases. Those that are done, give it all away—and then some! If any of the readers are in that group, the suggestion is to find a good mentor and stick with them. Quickly.
The US election aftermath will probably introduce a new variable into the mix. Trump is an outsider, a maverick even and therefore not very predictable. That always introduces uncertainty into the global economy. This time around, he is actually more ‘powerful' than back in 2016. Second term (so not really concerned about public opinion any more), controls both Senate and Congress (so, higher freedom to operate) and a world that is in a bit of disarray right now. So, across the globe, there is possibly going to be a Trump sector that may emerge—these will be stocks that are both positively and negatively impacted by Trump policies. We will get an idea of these only after he assumes office (Jan 20) and so, until then, the equity world may be roiled by a lot of speculation on which stocks may get impacted. It will be interesting to see if this happens.
Local politics is in a similar situation for Modiji. 5 years are assured and Delhi elections at the start of 2025 and Bihar elections at the end of the year are the only two state elections for the next year. Kind of leaves the road open for some policy initiatives ahead. Budget 2025 ought to be an interesting one. So, trended potions of the next year may commence after March 25 only?
Here is an interesting chart that we don't look at often but one that may have an impact on fund flows across markets. Chart 3 is Bitcoin Futures and what I see here is an unbridled bullish breakout!
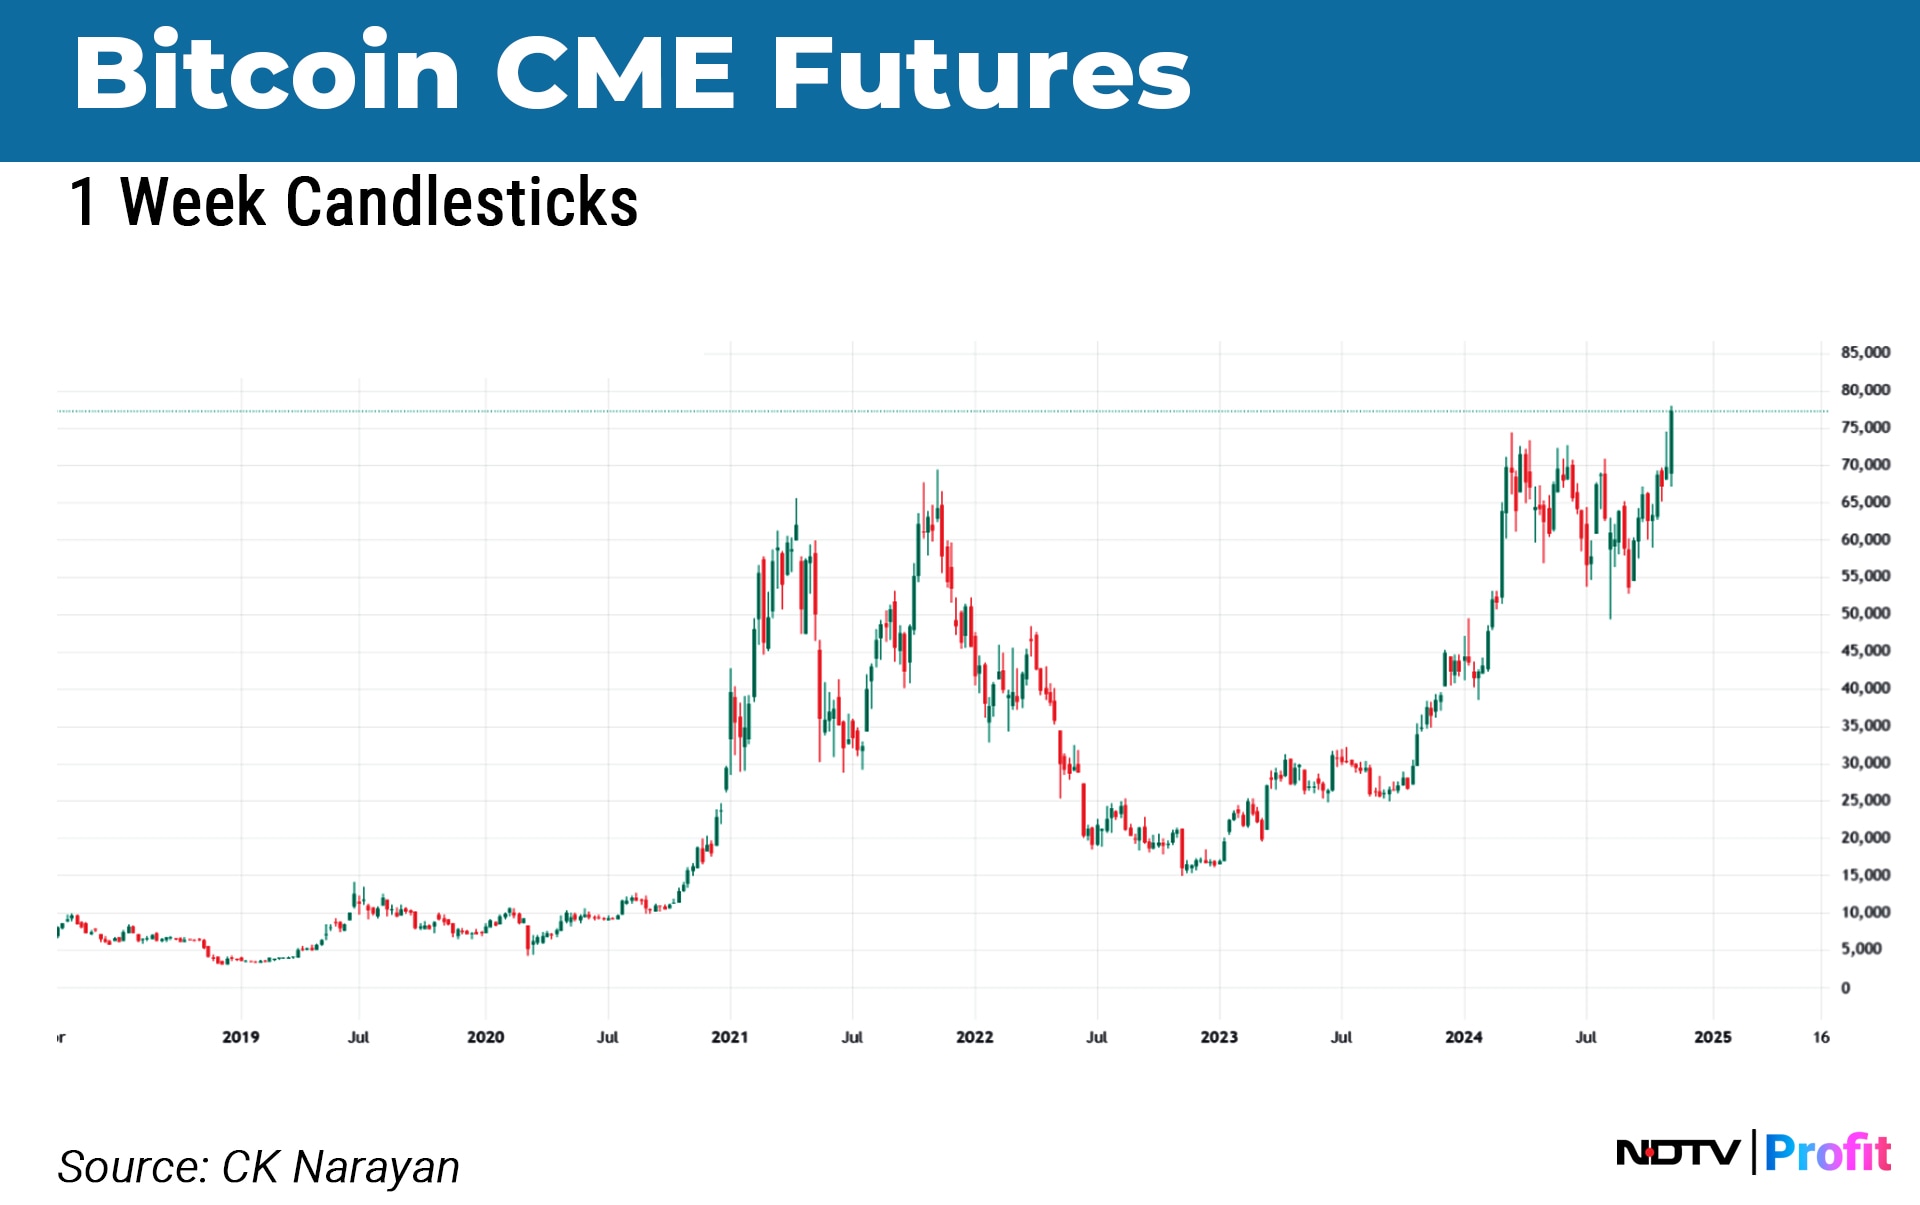
Long-term rounding formations suggest a 70% gain for pattern targets over the years ahead. Trump is known to be a supporter of Crypto. Charts are suggesting that good times are ahead for this asset class. It will now compete for money against other asset classes. There has always been some fascination about this asset class and I see that sentiment reviving after almost a year of consolidation.
Along side, we may see Gold lose its sheen? See chart 3, quarterly chart of Gold Comex. It shows a perfect AB=CD relation with BC being a 50% retracement of AB. Now, that is near perfect harmony.
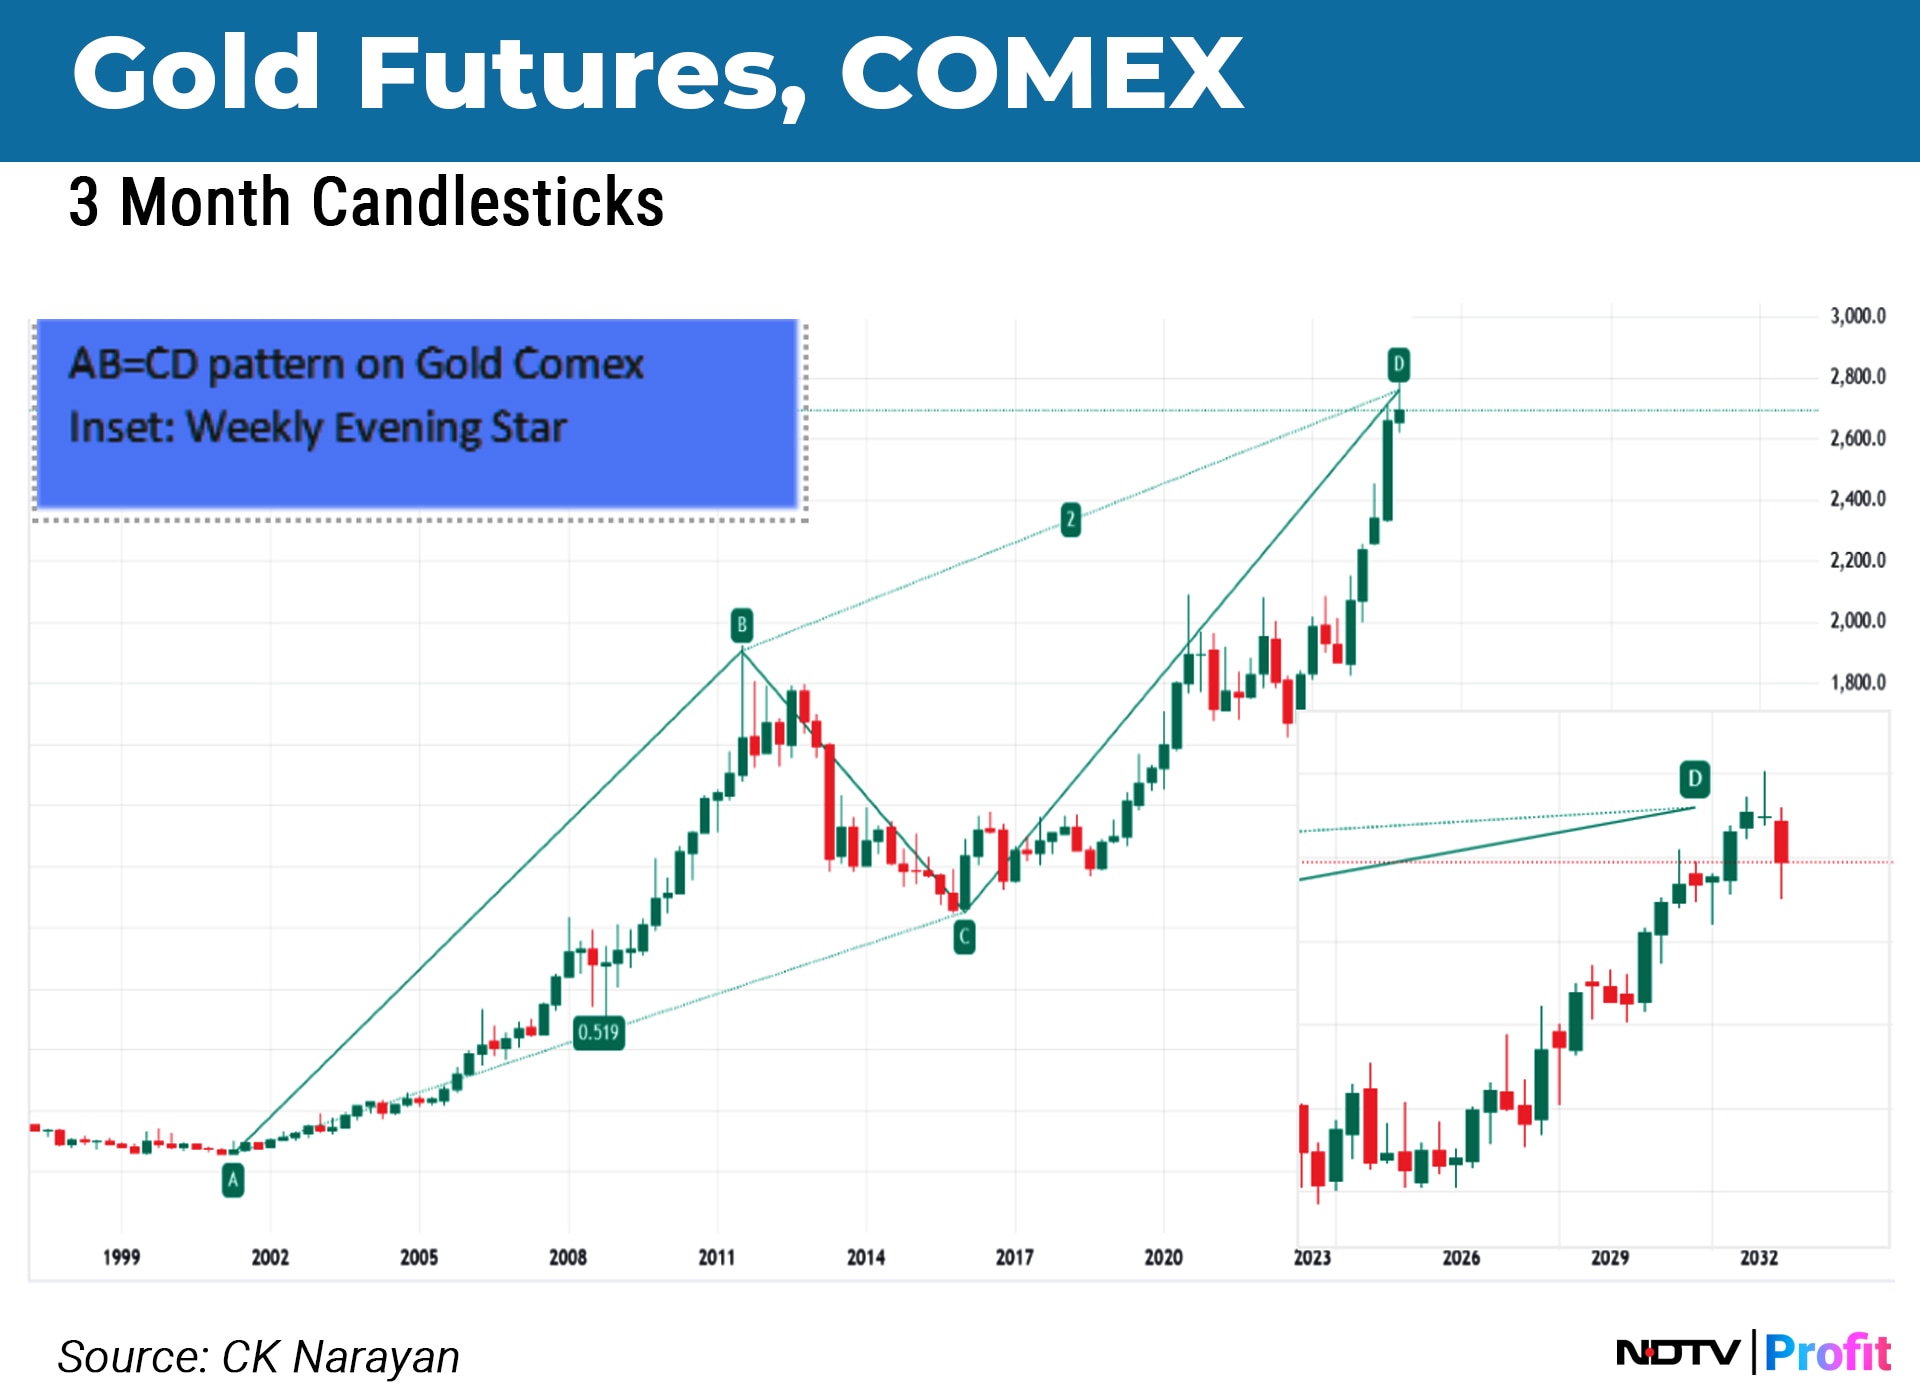
We should be watching the lower time frame chart to see if weakness appears. The inset chart shown here is the weekly chart where we can spot an evening star. Gold investors, be on the alert! In the past, we have seen that crypto is an asset class for risk while gold represents safety. In the aftermath of the US elections, if there is greater risk-on sentiment in the US, then money may move out of gold into cryptos and possibly the tech sector in the US.
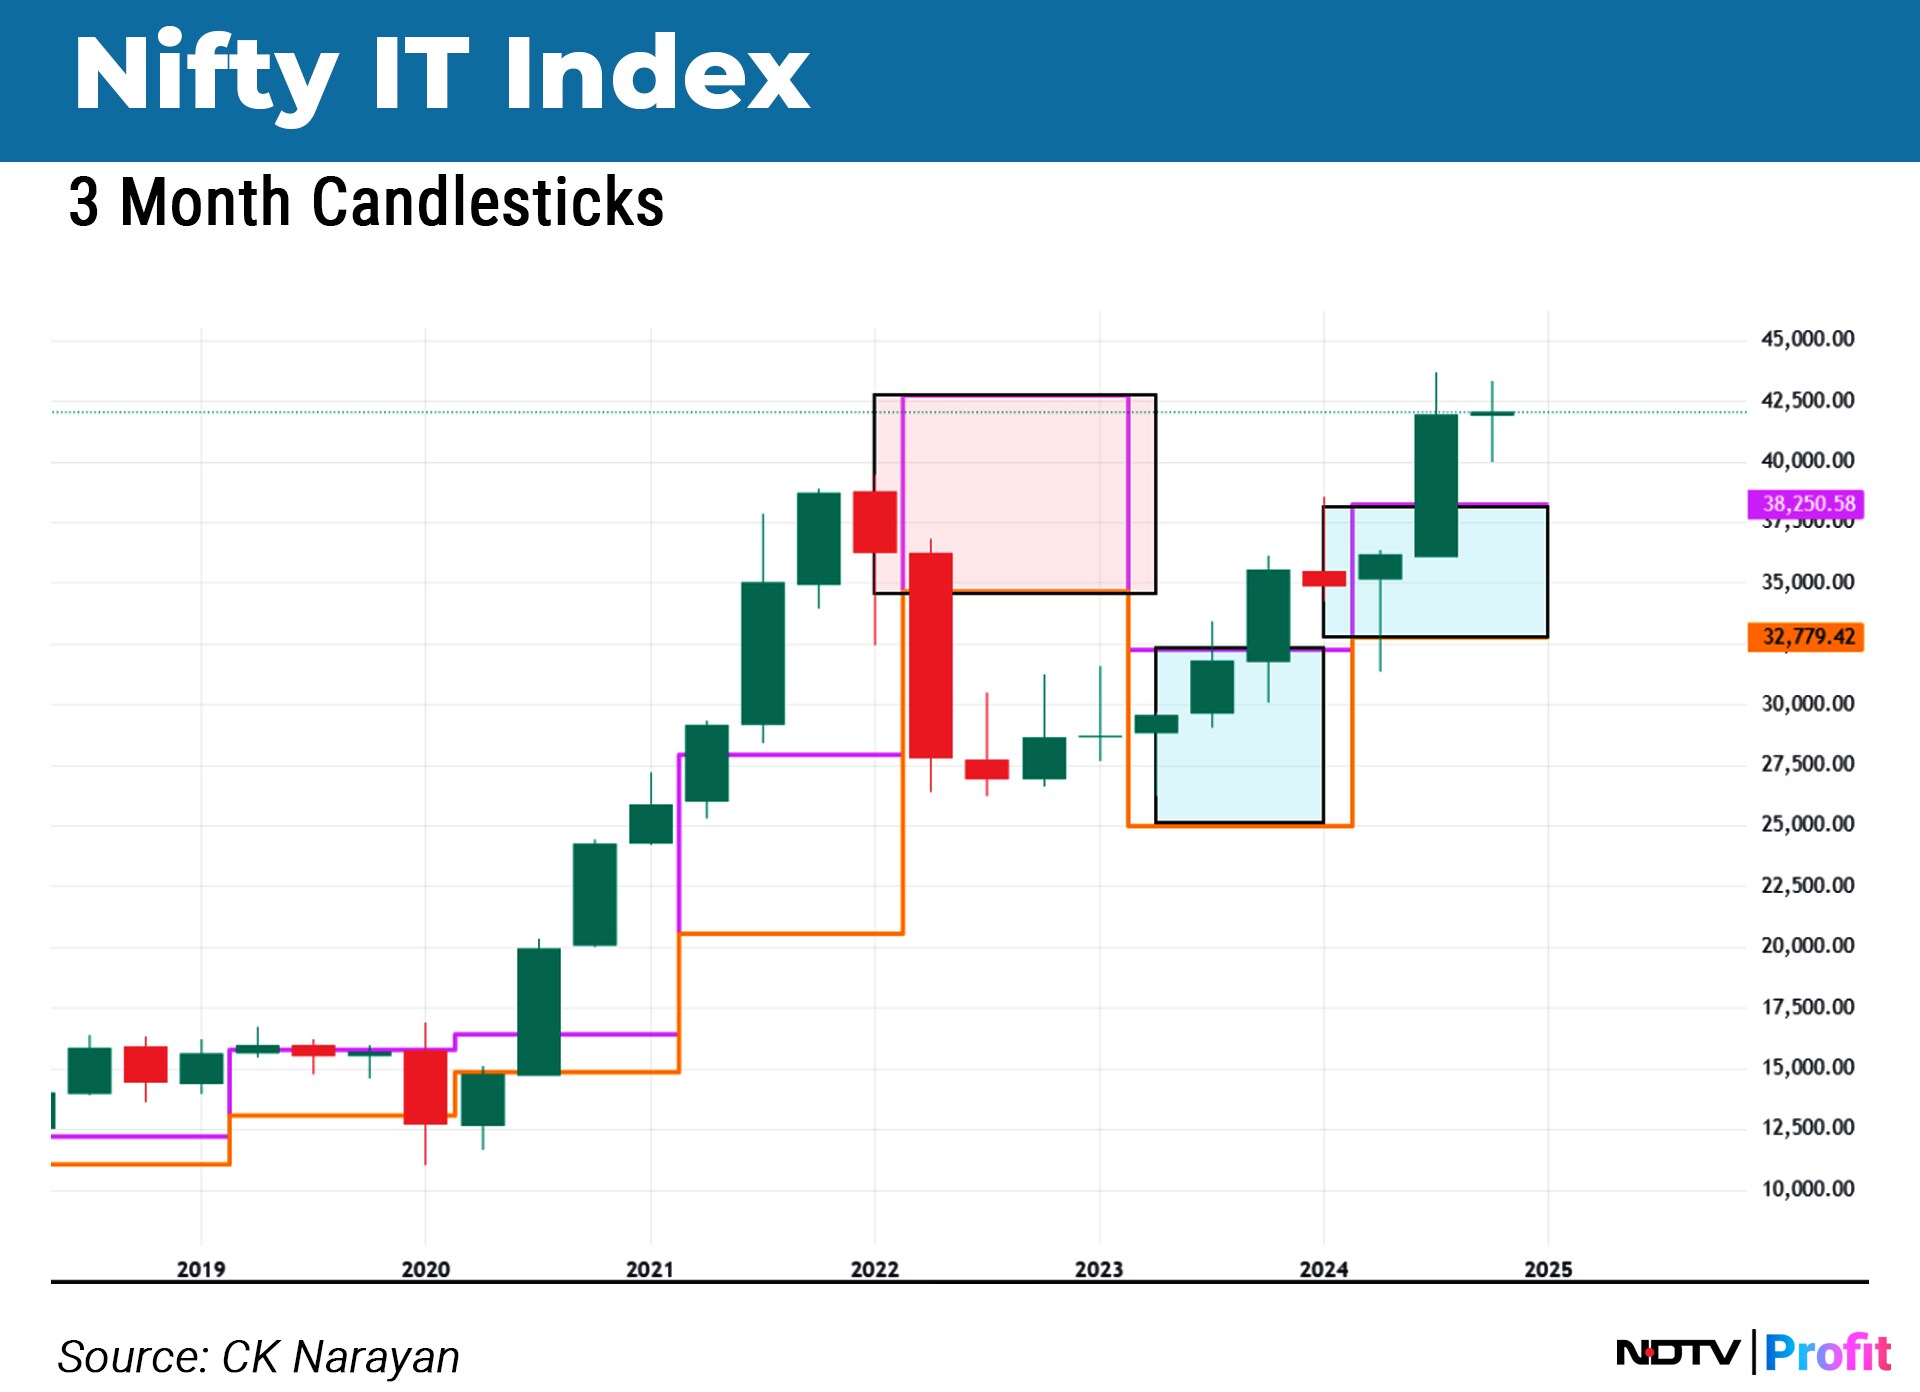
Can that stimulate the Indian tech sector to advance? The sector has been advancing since the lows formed in 2023 and now it is readying a challenge to the highs set back in 2022. Chart 4 is a quarterly chart of the Nifty IT with yearly pivot boxes drawn in. 2024 has signalled a revival of the uptrend. So long as 38000 is not lost by the index (current 42000), the sector is still in with a chance to continue its upward thrusts. The monthly boxes (not shown in this chart) are pointing towards continuation of the move higher. Hence, one may consider CNX IT sector to be possibly the first of the items that may figure in the new Trump Sector list! Now, which stocks will make it in this sector is a subject of another analysis. Maybe for later letters.
Summing up, a time of some turmoil. External inputs may have greater say in the progress of our trends for a while. Political uncertainty may be done with in the US but may continue to influence trends here until the state elections are done. That is not until Feb. 25. So, expect some ranging ahead now for a few months. This calls for a change in trading and investing strategies. While we work these out, there may be losses incurred. Readers are warned to provide for some setbacks in their work owing to this uncertainty. We have all had a nice 3-year-plus ride. It may be time for some multimonth adjustments and therefore to raise focus beyond day and week moves.
Essential Business Intelligence, Continuous LIVE TV, Sharp Market Insights, Practical Personal Finance Advice and Latest Stories — On NDTV Profit.


