

Alluding to the kind of movement we are witnessing currently, I had mentioned that any dip that may occur shall be a laboured effort since there were many candle-body gaps. We did see some pullbacks and the index dropped three sessions before righting itself a bit with a minor rally.
In the last week, I had also annotated the chart with a 1-bar swing chart of Gann and at the end of the week, the upmove continues to remain intact. The updated chart of the same is shown in Chart 1.
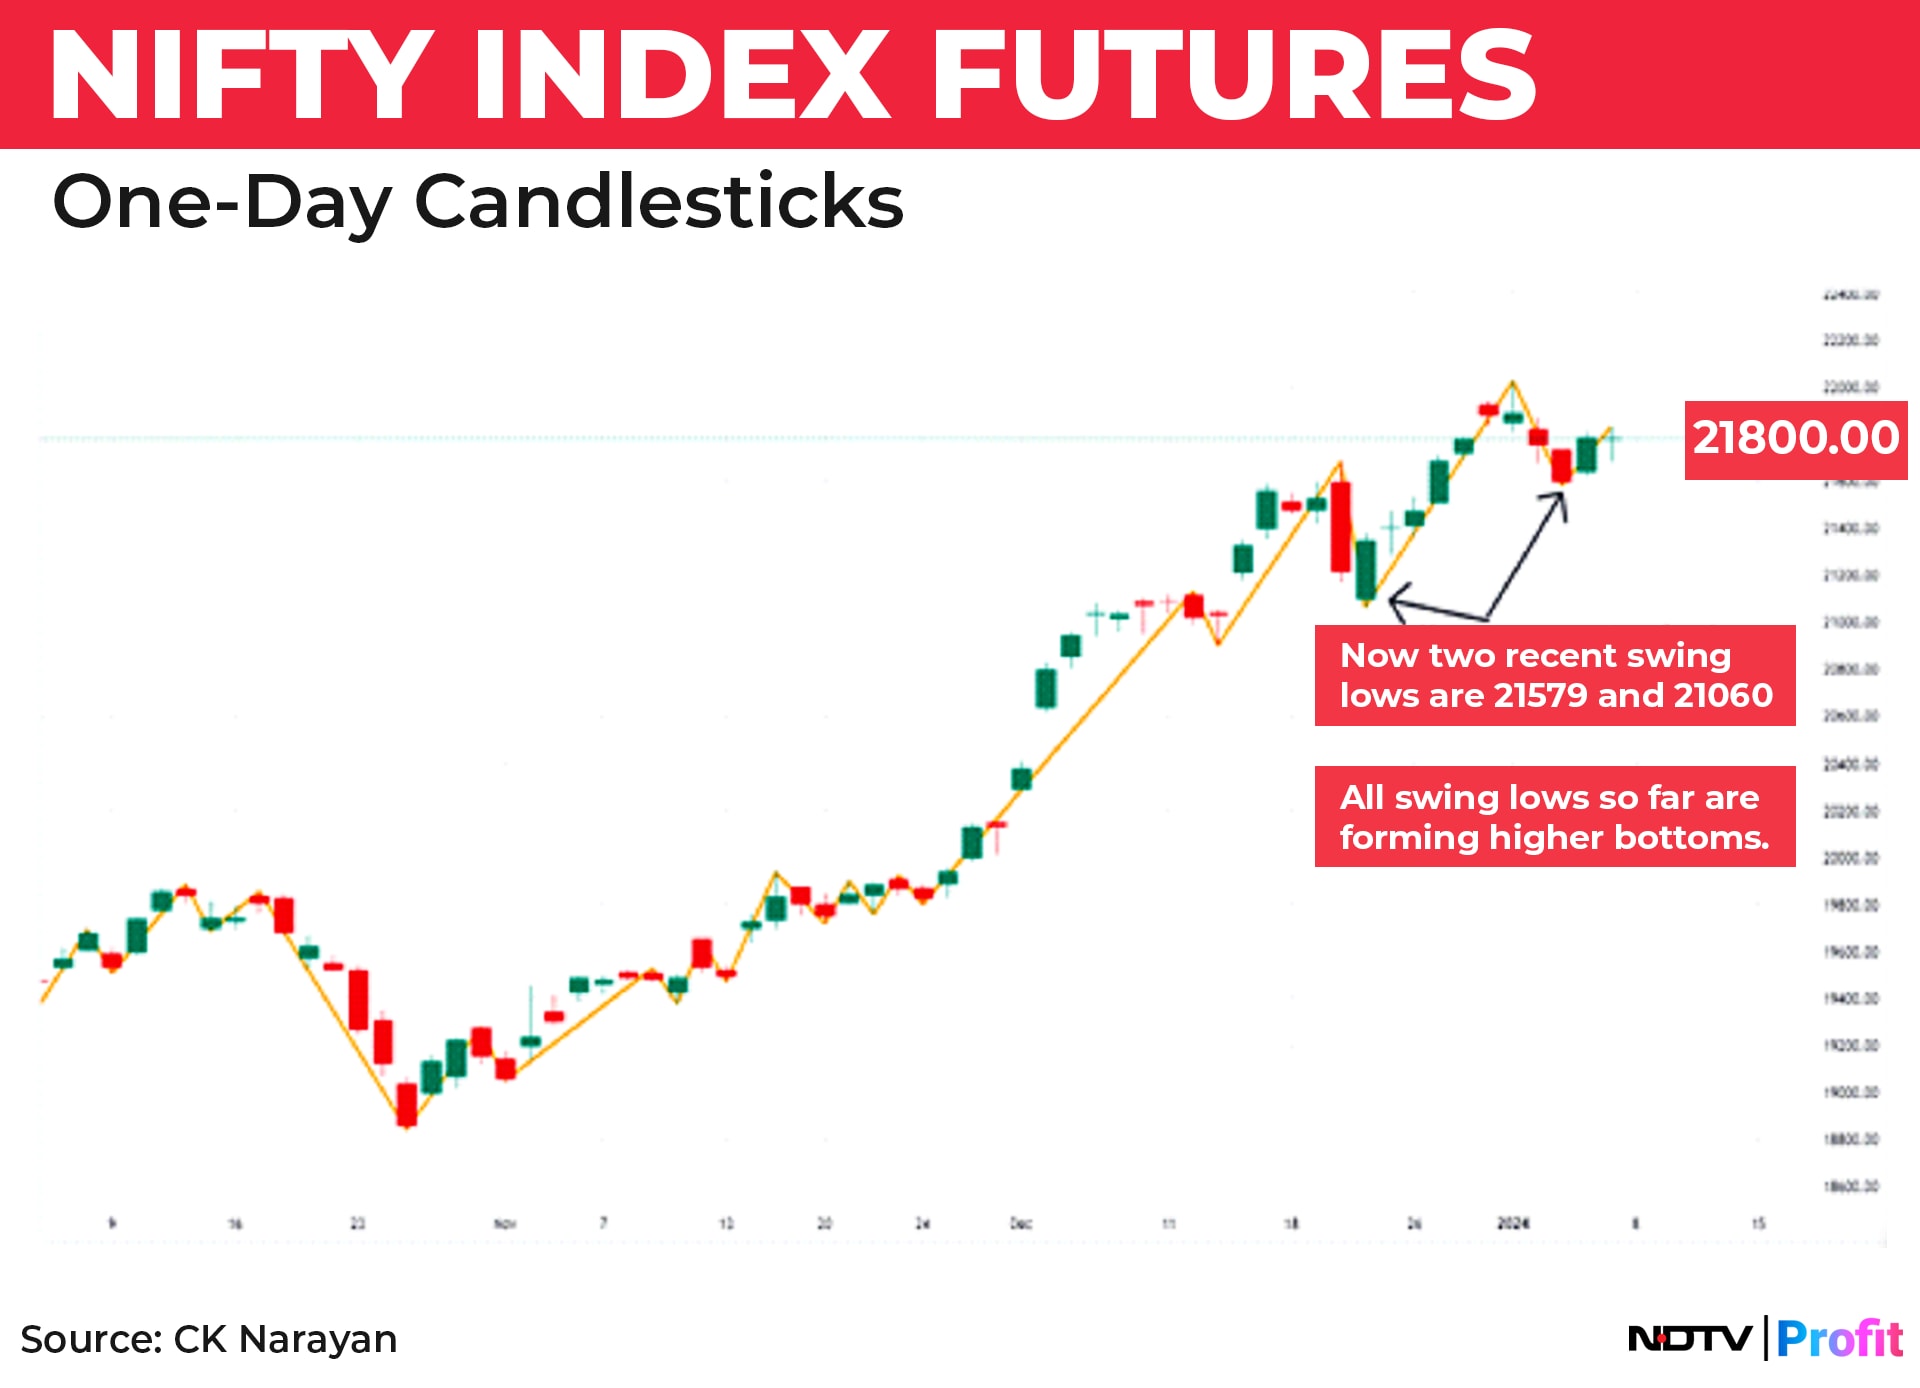
We formed yet another minor swing low in the process and that now gets counted as the nearest swing low, making the 21,060 low as the second swing low behind.
This is important from the stoploss setting level. The usual practice is always to set a stop below two swings behind. Thus, as a trend follower, the trailing stop on a long Nifty futures position, the stoploss moves up from 20,900 last week to 21,060 at the end of the week. All swing bottoms are still higher than the prior ones, ensuring that the trend definition, which is up, remains undisturbed.
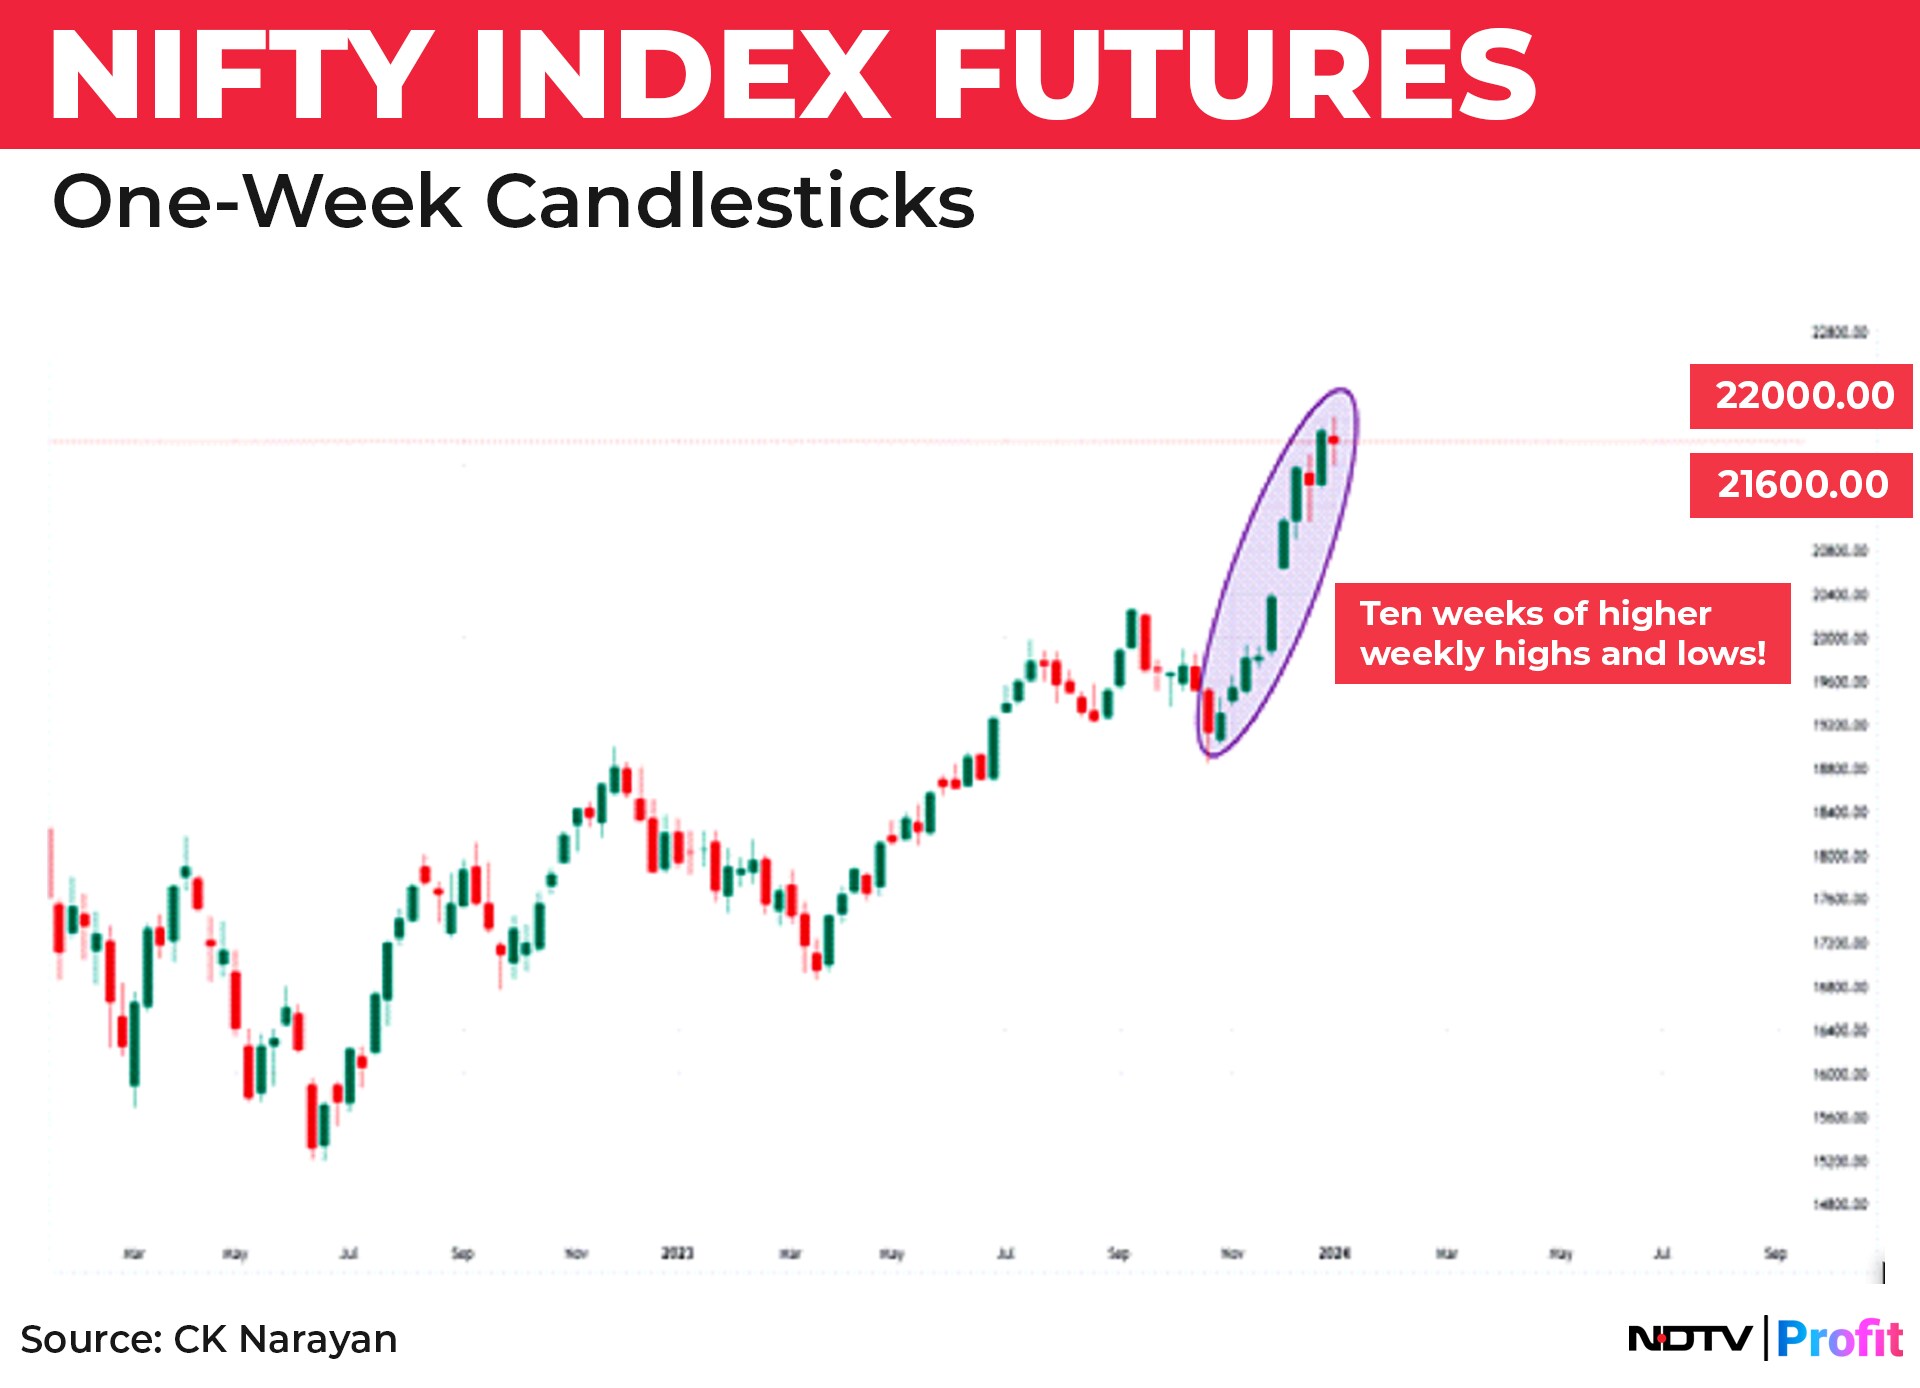
It was not the best start to a new year, especially after ending the previous year on a rather blazing note, but for the record, we notched up a new high at 22,025 on the futures.
But the pattern on the weekly charts continues undisturbed, too. We closed the week as being the 10th one in succession where the prior week's low has not been broken. Not just that, it has also been in unbroken higher highs for 10 weeks in a row. It is not rare to see higher tops being put in, but to see them also accompanied by higher bottoms in succession is something that I have not seen in a while. This also means that there hasn't been a consolidation week either. No wonder the party has been so fantastic. This move actually began from the Oct. 26 low, got a boost post the state poll results on Dec. 3, and has not let go until now.
This can be seen in Chart 2.
Can that be considered as yet another evidence of the market trend getting stretched? Yes, it can. In the last week's letter, I had also mentioned about the stretched oscillator set ups. That situation continues but with some added signals. See the chart for Nifty daily with the RSI and ADX.
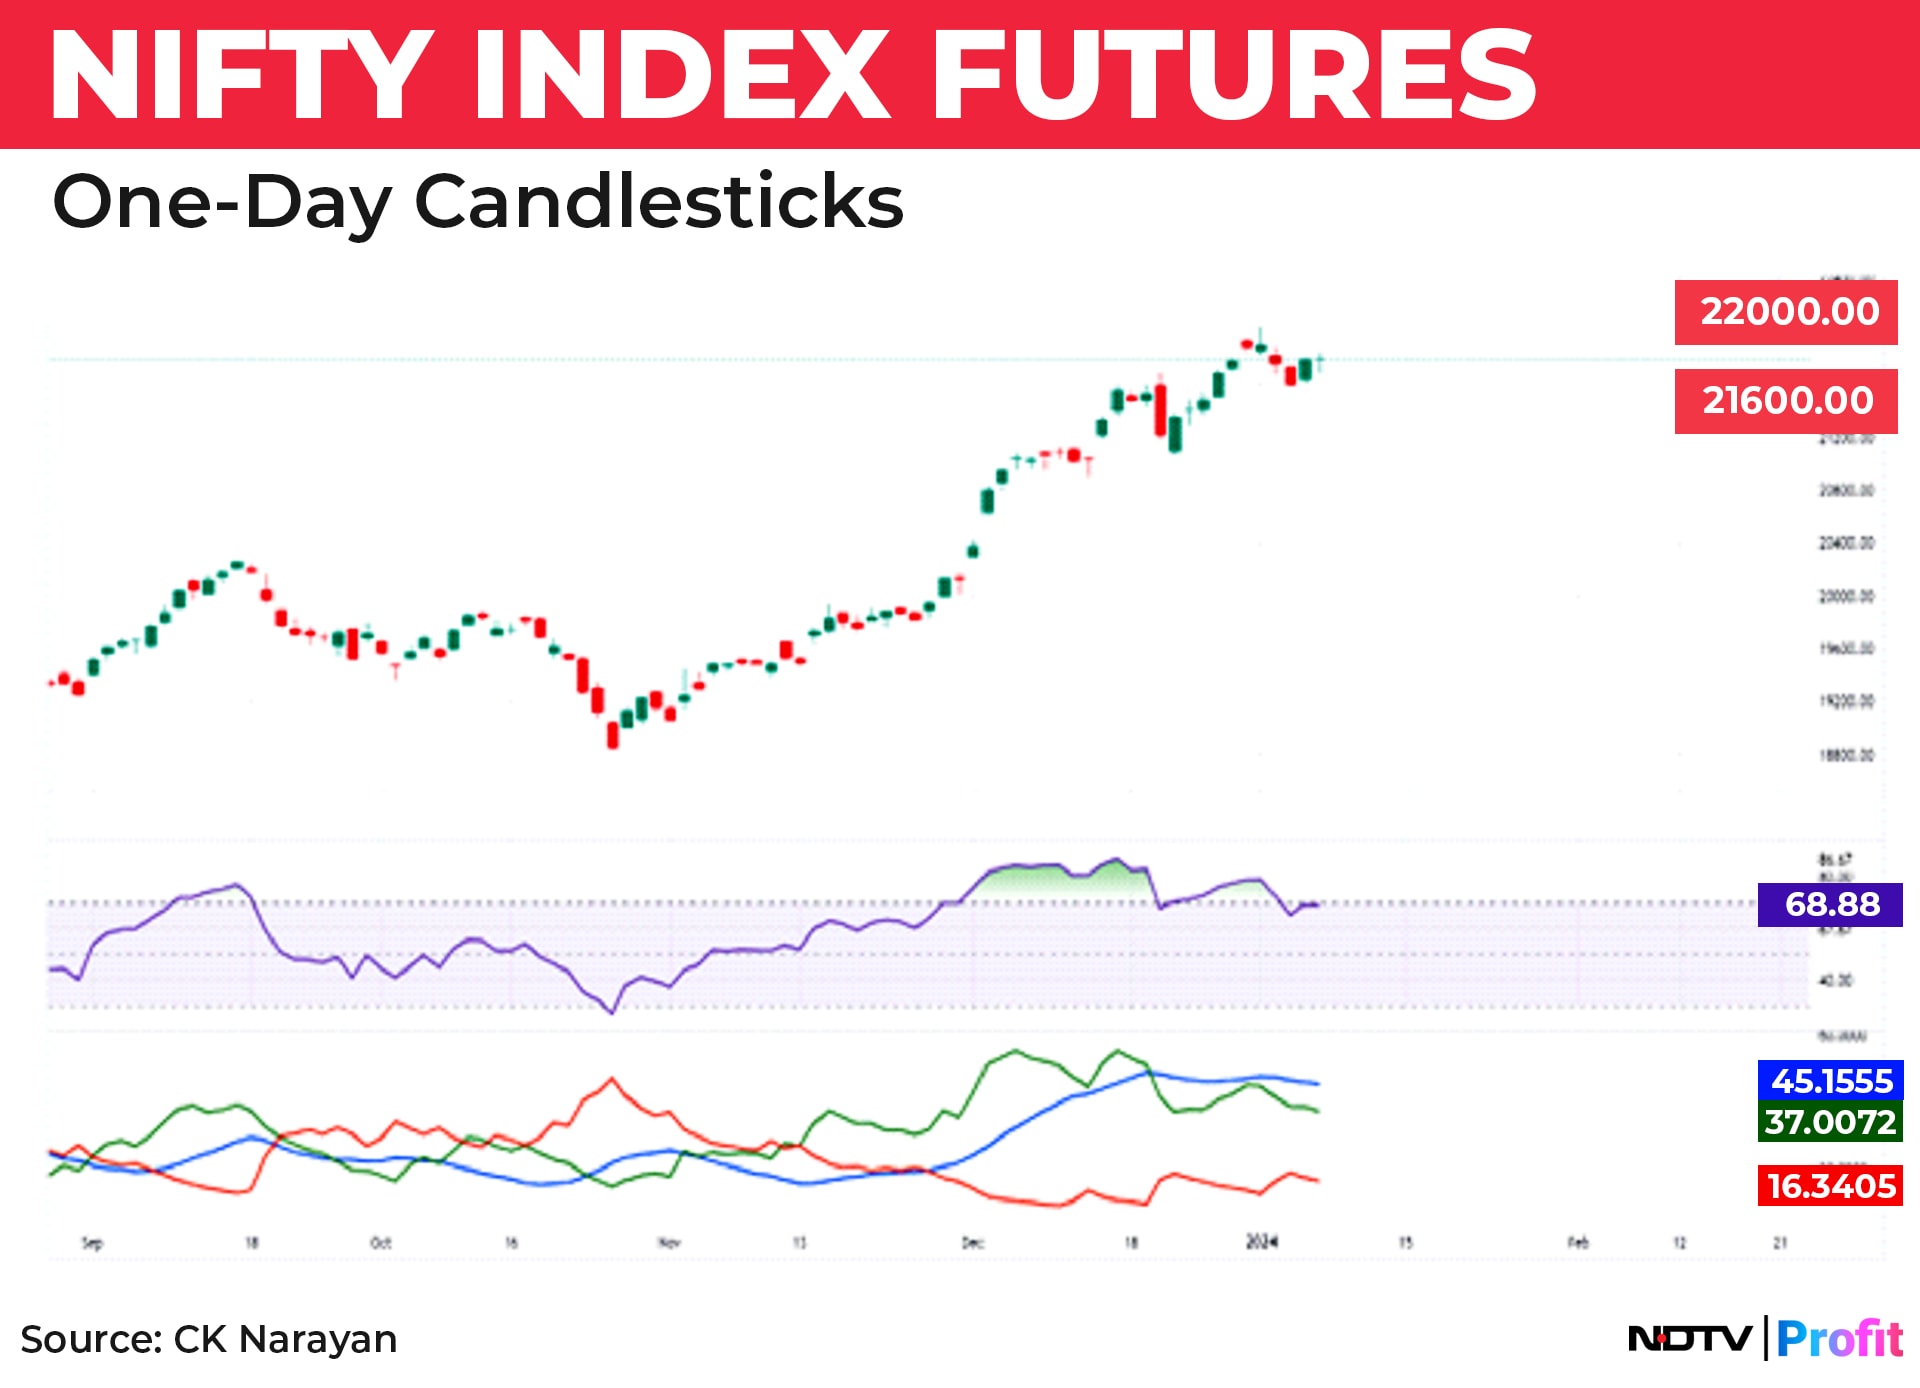
While the divergence pattern is clearly visible, we also had a hint of a positive reversal pattern with the minor dip to 21,600 closing in the last week. This signal, if it persists into the next week, can erase the impact of the divergence warning signal. The key for this would be to watch for a close below 21,217 in the week ahead.
If that happens, then the reversal pattern would get erased. If it does not, and the prices move up, then the RSI signal itself will set up a new high target of 22,270 ahead. Recall that I had suggested a target into this zone in last week's letter itself and the oscillator pattern is a kind of confirmation of that projection.
This can also be used by traders to move their stops on the longs to just under 21,215 using the oscillator signal too. As you can see, there are many ways to skin the technical analysis cat.
In addition, one can note, in the ADX indicator, that the DI lines are nicely apart, and it would require a decent move in prices for them to cross bearish. The ADX line has flattened out, no doubt, and that points to the possibility of some consolidation.
Last week's letter was more about the projection for 2024 and I had left out the part about a smaller window (between Dec. 31 to Jan. 15), where the current move may see some topping-out action. Since the current momentum is still quite strong and the sentiment is stronger than ever—after all, the market managed to come up from two attempts to go down, didn't it?—chances are that the topping action would be strung out across a window that may last till mid-January.
So, what we need to do is to look for the higher prices mentioned this week and the last, and see if those price zones are being hit around the middle of the month. This would be a nice price and time match.
I have also pointed out other elements that can contribute to this topping identification above, like if the pattern of weekly higher highs were to break or window gaps not developing in any rise from the current levels or a failure of the positive reversal pattern getting dinged. Or bearish-wide range candles emerging or most rising candles being small-body affairs or the breadth faltering ahead. There are many signals that one can look for.
The whole purpose of creating price and time targets is to alert us to look more closely at these simple but unobtrusive signals that show up. But in our excitement of being in the market, we often miss them. This leads to a big loss of alpha gained.
This is especially so if the market hits new highs yet again, for that will surely get more of the sentiment juices flowing and caution gets thrown to the winds at such times. Just the thing that one should avoid.
Please note that nowhere in the above have I started staying away or not participating. Most people think that it is the best way to avoid risk of reversals of trends. That is only for those that are not prepared to do the work. I expect that most of our readers are not in that list. I provide some guidelines, signboards and streetlights on the path ahead. Readers have the responsibility of recognising those in the week ahead so that their actions can be appropriate.
If you combine the signals coming from the RSI and the ADX, then it appears that movement ahead may be slower than what we have experienced up to now. I would think the chances of 21,060 breaking are still quite low and, therefore, one can still be a bit aggressive yet.
However, that continued aggression should be tempered with a greater focus on the details of the movements that occur with every passing day. For, when price and time targets are near, it calls for us to be more on the alert.
Since we are trading at all-time high levels, for searching for immediate resistances, we have to drop down to lower time frame charts. Accordingly, the next chart is a 30-minute chart of the Nifty future, showing volume blocks plotted as horizontal strips. These are areas where demand and supply volume have been identified. See Chart 4.
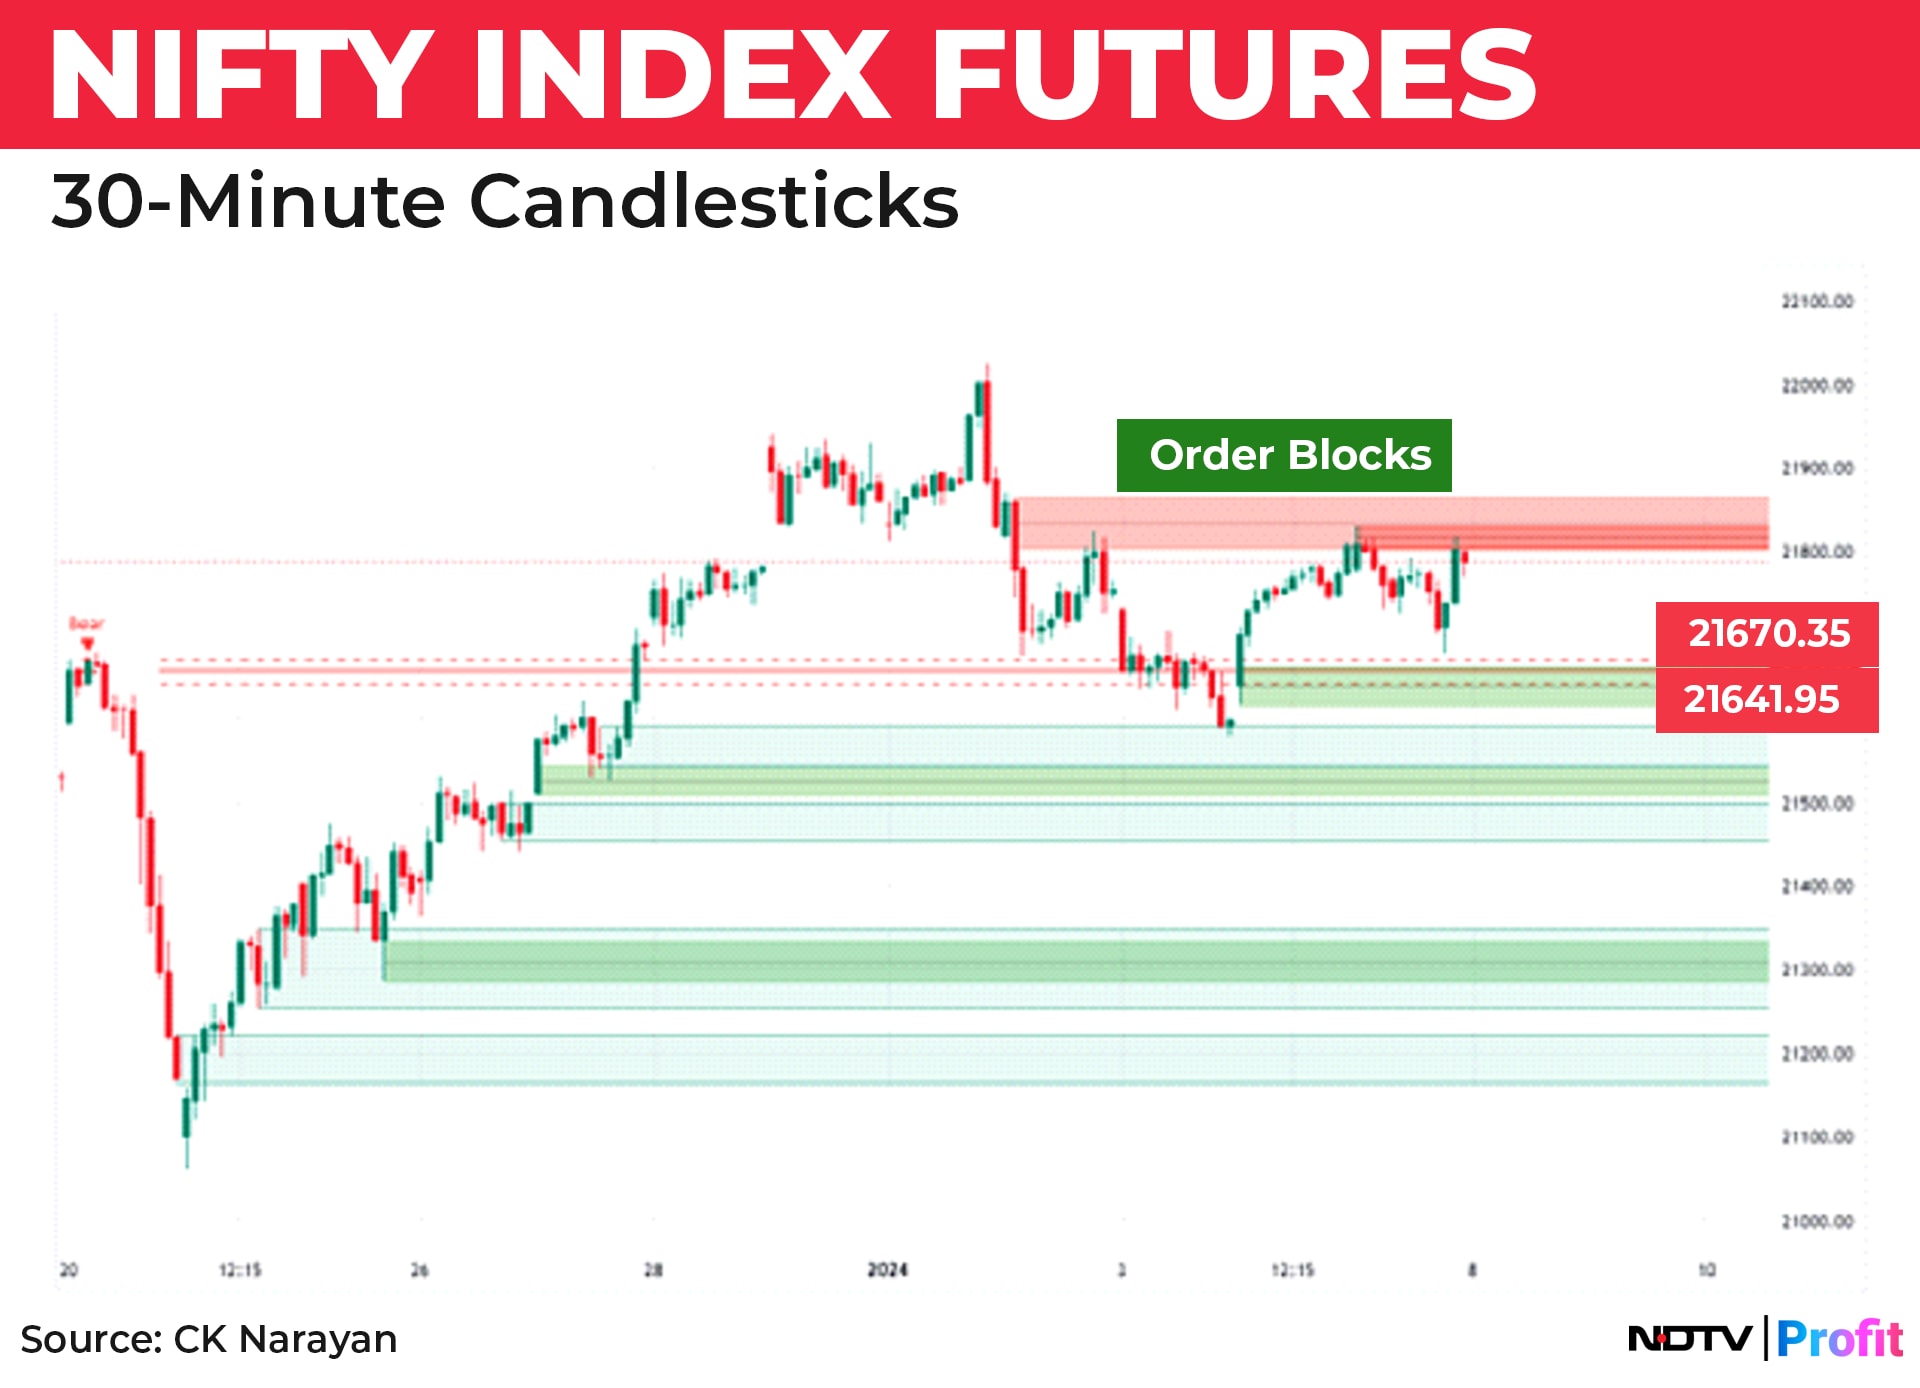
We can note that the prices managed to claw back to the levels of the selling volume that emerged on the correction of the last week. This pullback seems to have added a bit to the selling blocks plotted. Hence, the trends will have to push higher, past 21,865, which will also clear the 62% retracement of the most recent fall and only then, the bulls will have the game.
On the lower side, one cannot note several demand blocks that have been created in the rise from the Dec. 23 low and these shall provide the requisite support. Once again, we see that the market is creating sufficient support points as it goes up. Hence, there is very little danger of any collapse—one of the biggest fears of people when prices are high.
So, I have outlined the requirements on both the upside and downside for readers to judge the market moves in the week ahead. Use as directed.
CK Narayan is an expert in technical analysis, the founder of Growth Avenues, Chartadvise, and NeoTrader, and the chief investment officer of Plus Delta Portfolios.
The views expressed here are those of the author and do not necessarily represent the views of NDTV Profit or its editorial team.
Essential Business Intelligence, Continuous LIVE TV, Sharp Market Insights, Practical Personal Finance Advice and Latest Stories — On NDTV Profit.


