The markets obliged with the much-awaited thrusts to all-time new highs on Friday, leaving everybody with a good feeling. The thrust to new highs was powered by good macro data coming out of both India and the US. We were lamenting, in our earlier letters, that we were largely devoid of triggers to make the market move much. Therefore, when the GDP numbers sprang a big surprise, the market responded with an enthusiastic upside gap and a strong finish for the week. The continued encouraging performance emerging out of the US helped the markets considerably. But, as can be seen in Chart 1 (30 Min Nifty Futures) the pathway was not an easy one.
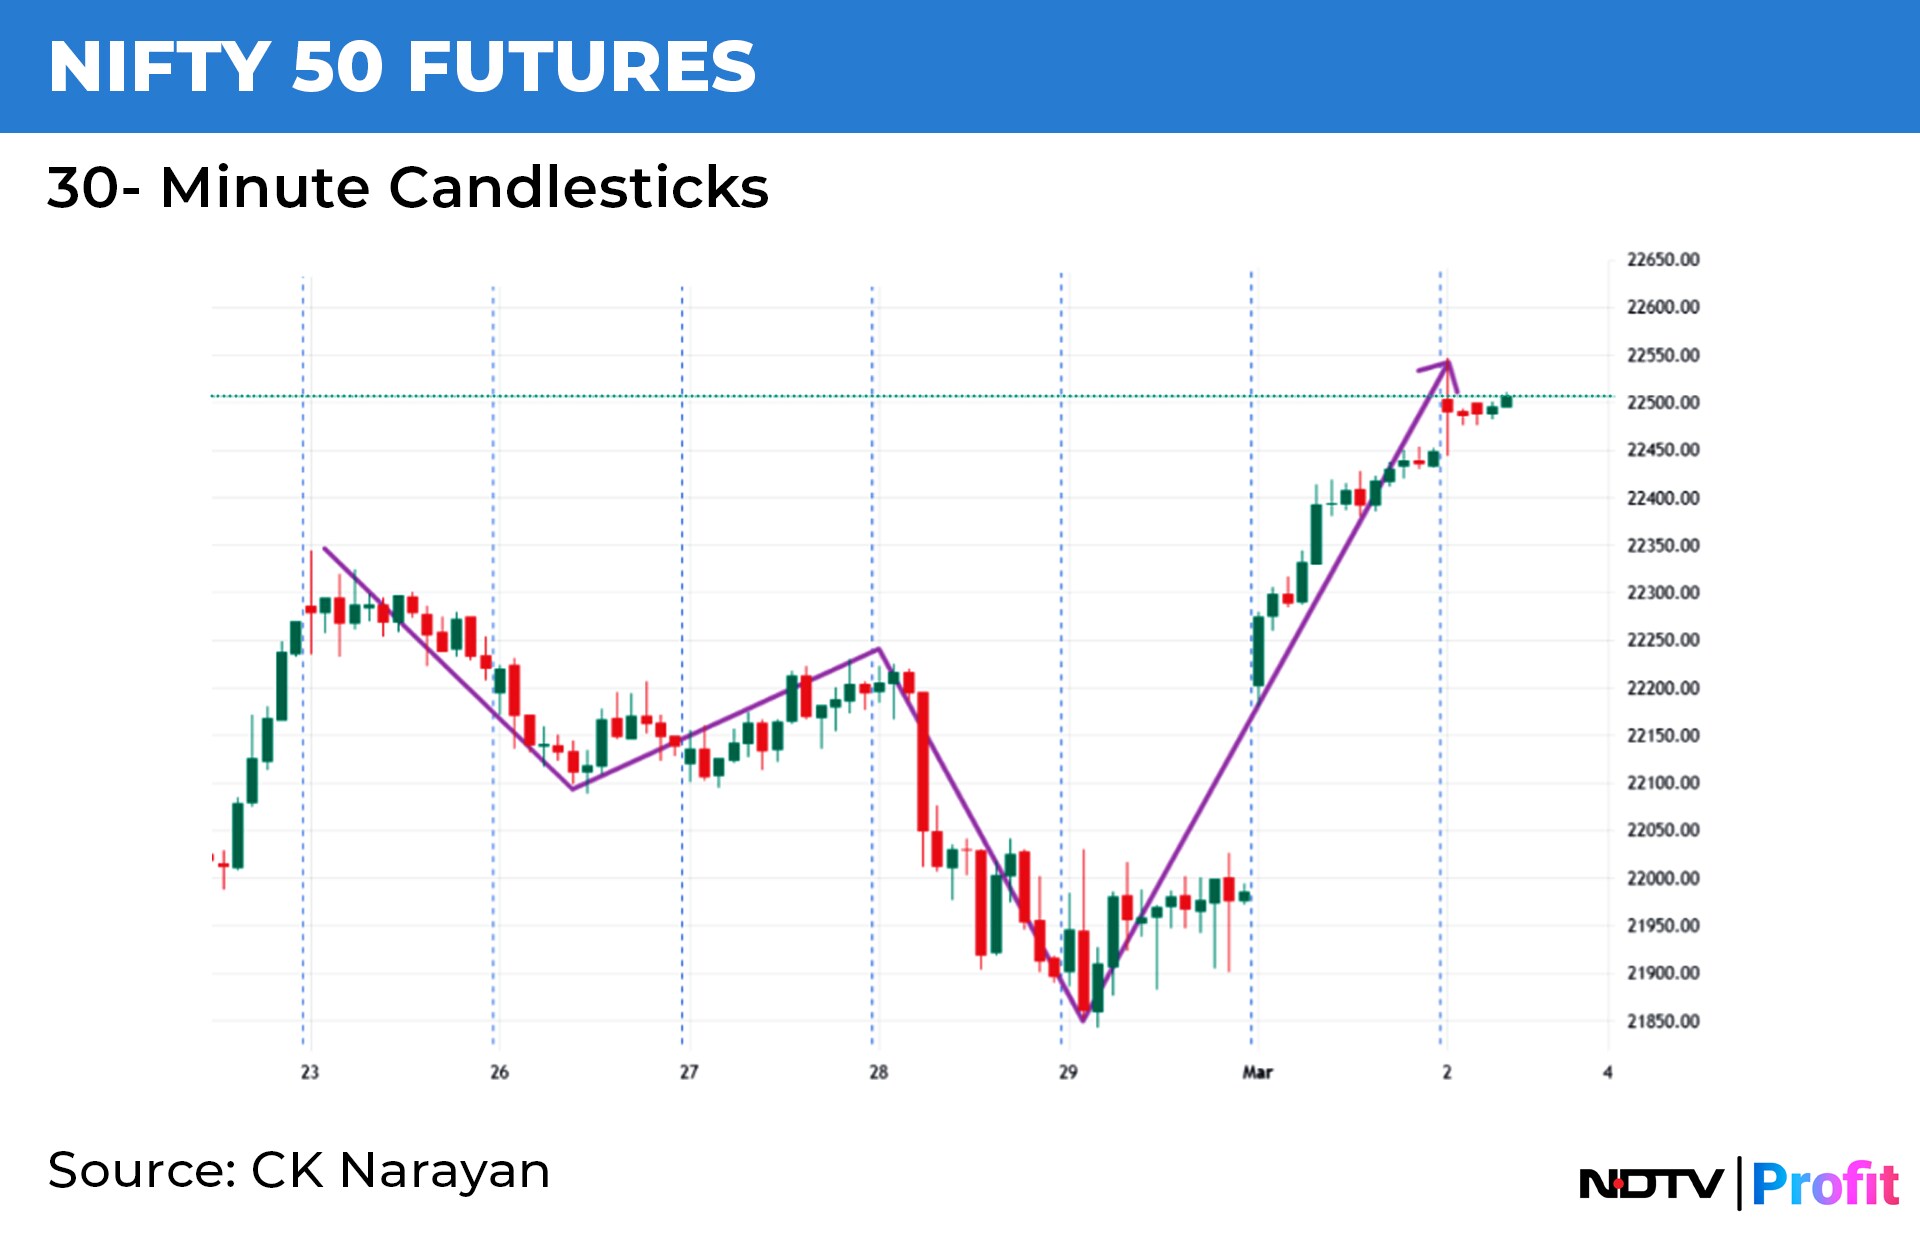
Recall that we had indicated a possibility of a high in the previous letters during Feb. 22 to Feb. 24. As if on cue, the index did top out on 23 and started taking a downward path. Prices retraced from 22,344 all the way to 21,851 by Thursday and it indeed seemed like a corrective move was about to unfold. In the last letter, I had indicated two stop losses with prior swing lows (21,600 and 21,150) and it was gratifying to note that the intra week managed to hold comfortably above these two stop-loss levels, thereby leaving our long trade open. Those with continued longs were sitting pretty by the end of the week.
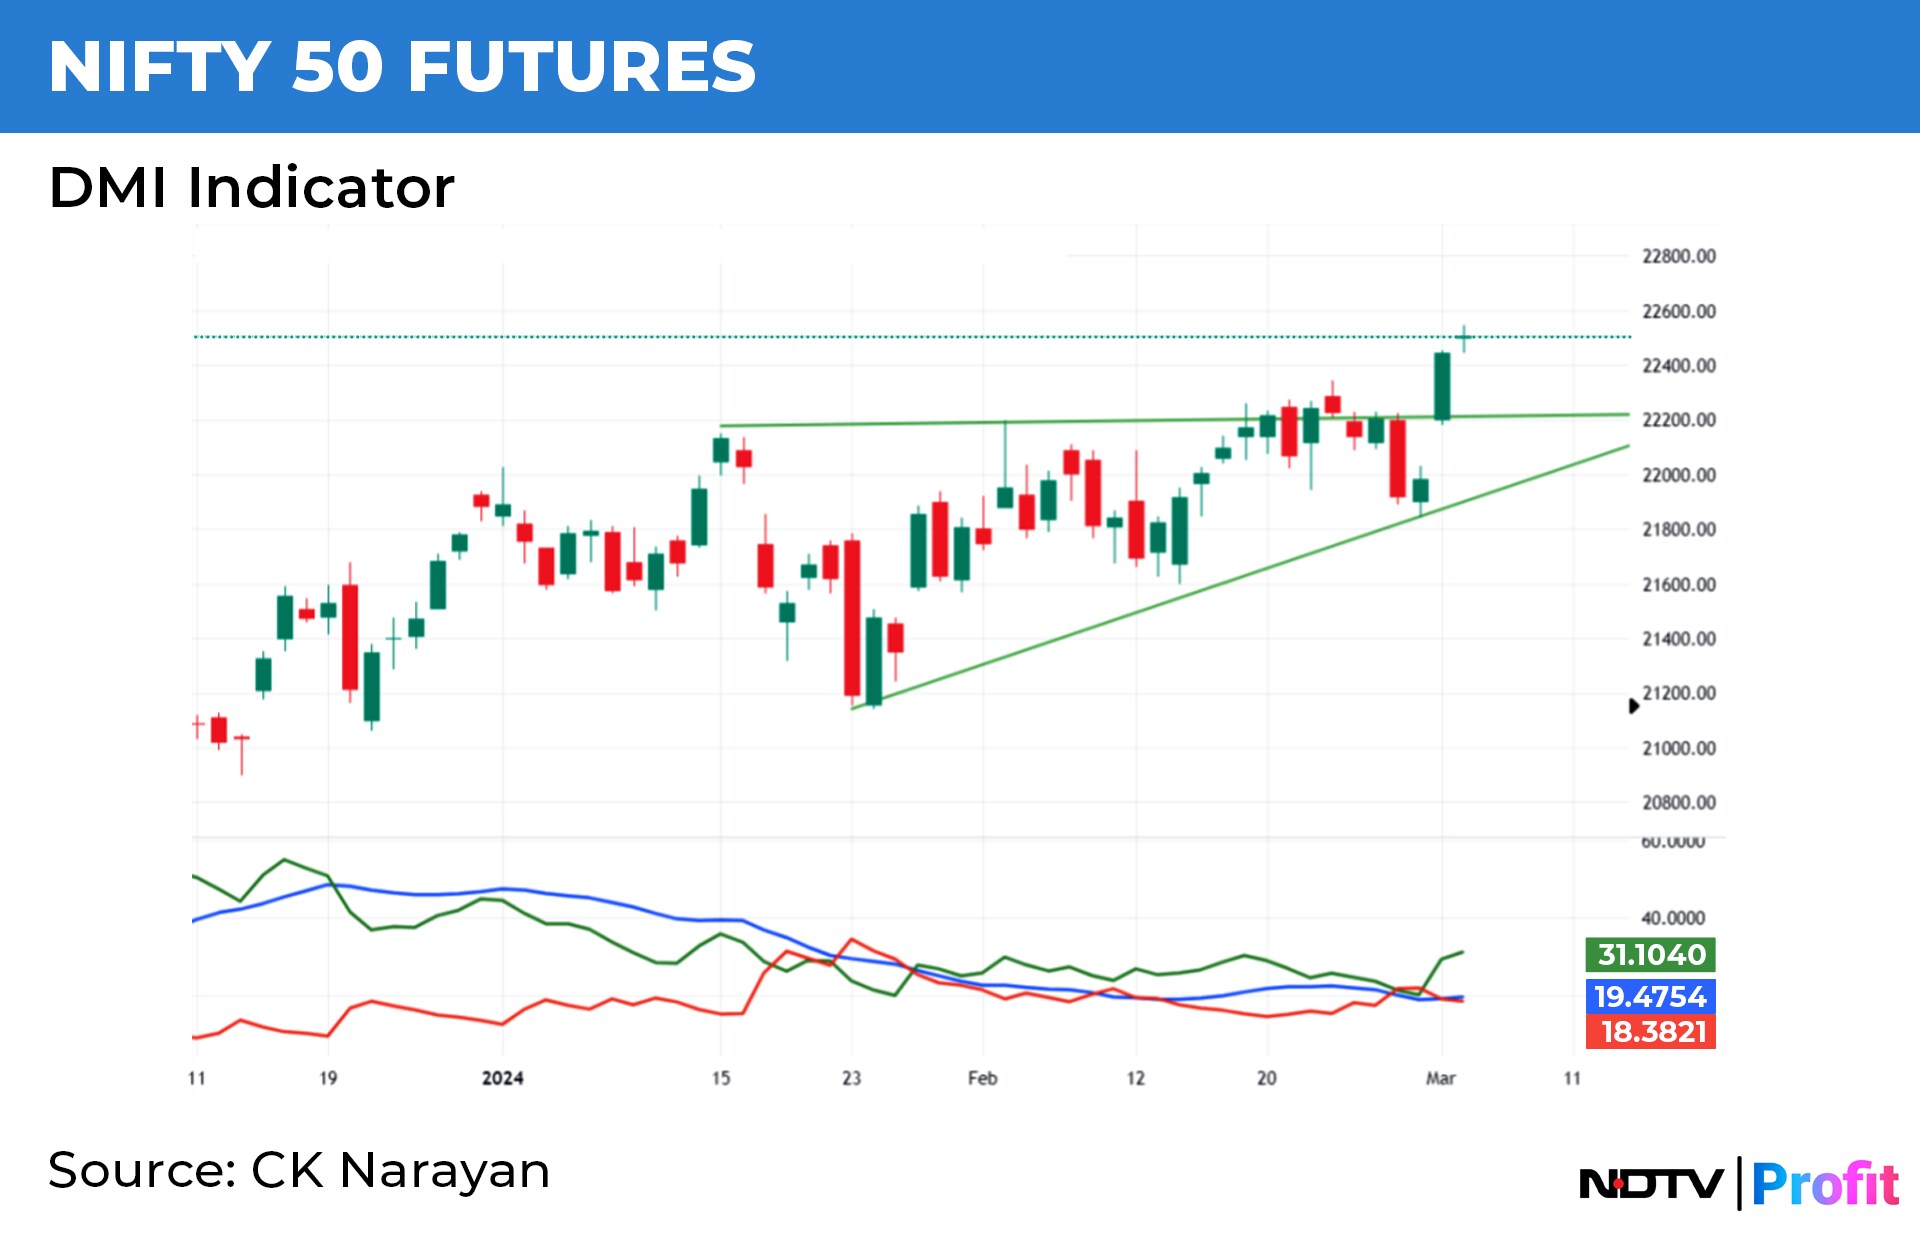
This now enables us to use the same swing low method to shift our stop loss further to SL 1 being 21,850 and SL2 being 21,650 as being the nearest levels for active traders. The same is marked on Chart 2 where one can also note that the Nifty has staged what appears to be a rising triangle breakout. The likely target that is emerging from the breakout levels around 22,250, which is showing a possible move towards 23,250.
Also to be noted in Chart 2 is the situation of the DMI indicator. Here, note that the bulls have been in control ever since the end of January, and even though their dominance was questioned ever so slightly during the last week, the Friday rip fully reestablished the bullish dominance. Further, the ADX line that had commenced on a descent from end Dec 23 signalling some ranging action ahead had also retreated to the neutral levels and the end of week thrust has now managed to get the ADX to get up and rising again.
In the coming days, a continued improvement of the ADX line is what one should be tracking alongside the widening of the DI lines. This will confirm that the new momentum created by the macro data is continuing to have a positive impact on the trends.
Checking for time cycles for March, I find that the first of the turn date is March 4 that is Monday, so the movements that have been set off on Friday should ideally need to sustain beyond Monday, not the rest of the week. In such a case, we can look for furtherance of the trend until the next turn date for the month appears on March 15. Note, however, that the failure to sustain the upthrust beyond the 4th indicates that the up move was completing the time unit of an ongoing upward cycle (from end January). In this case, one should become more alert about the stop-loss level indicated in the letter.
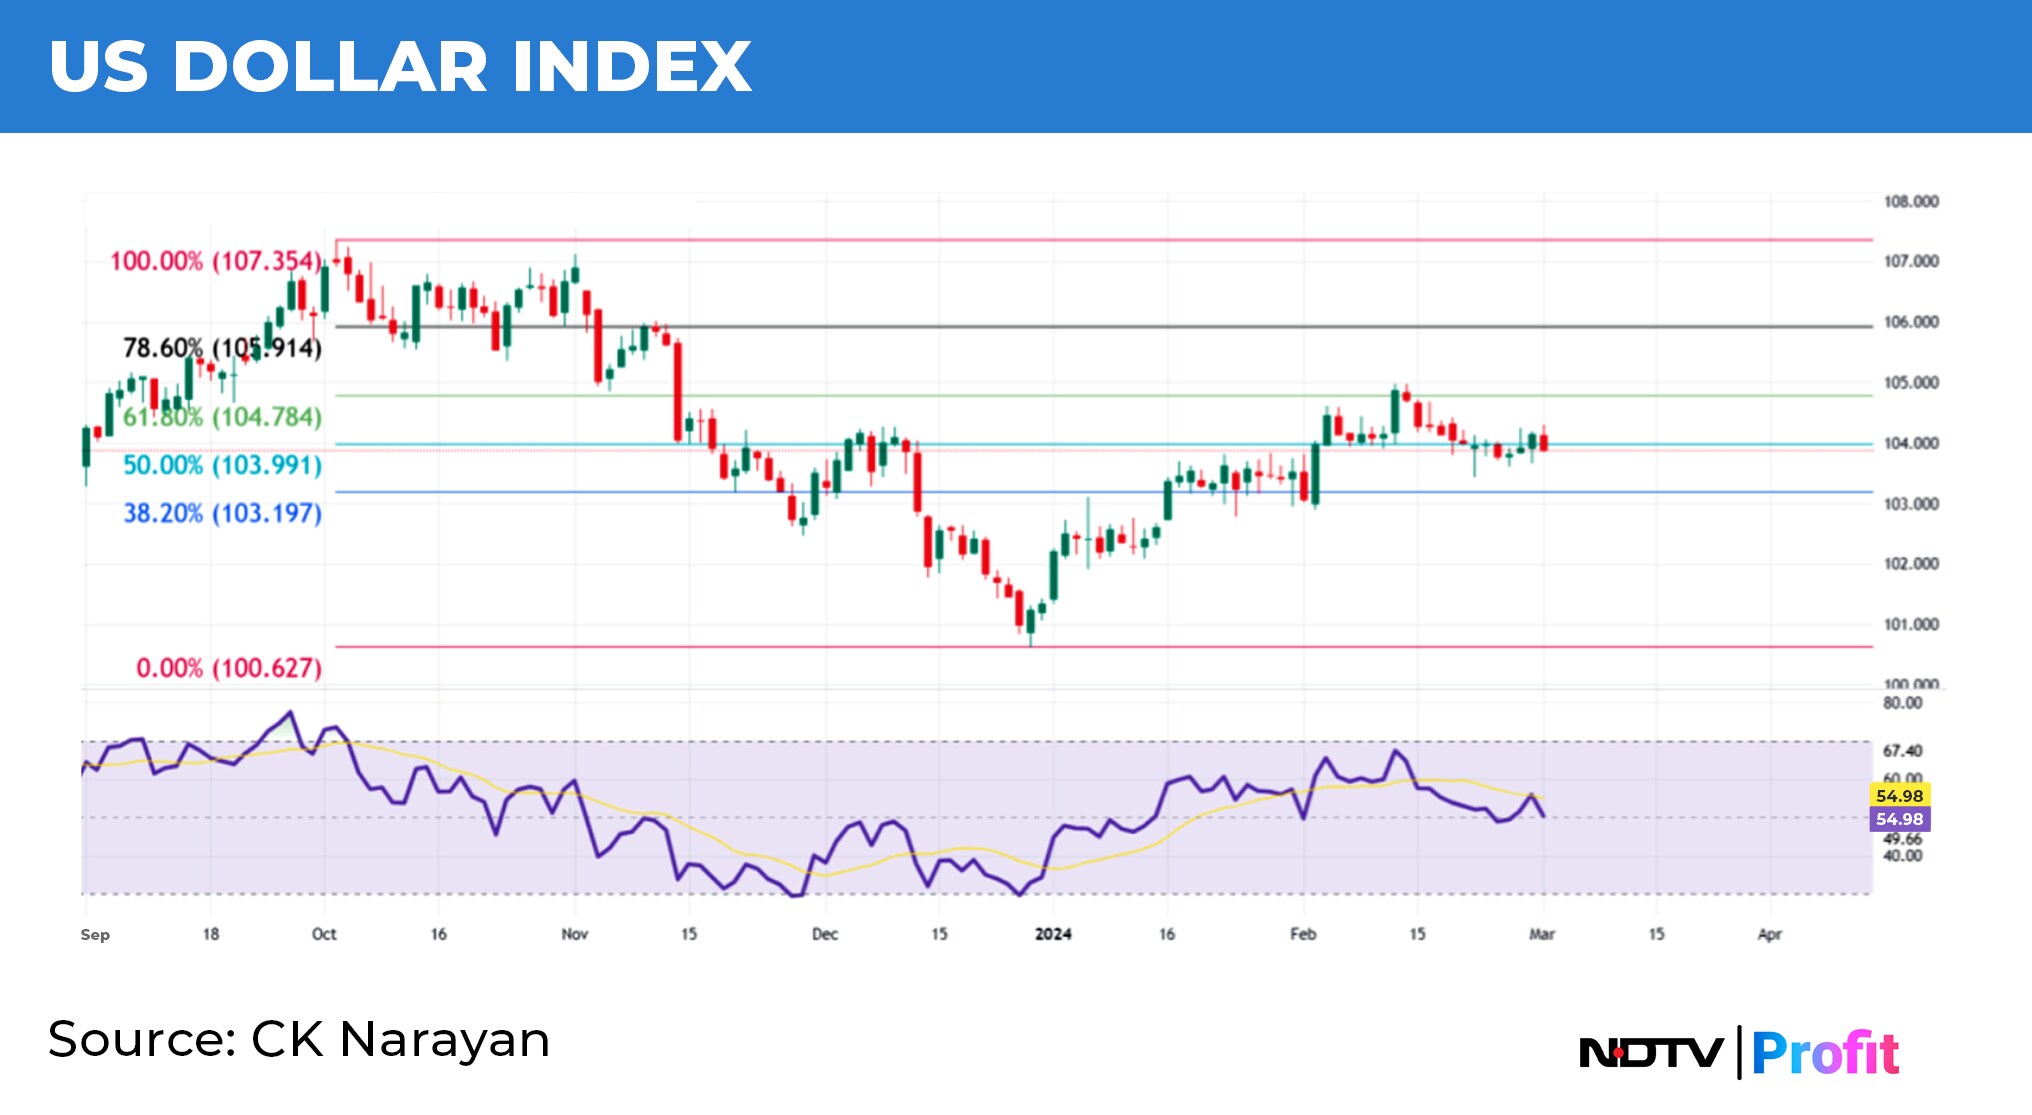
An interesting chart that might have an impact on the equity markets is the USDINR. Chart 3 shows DXY and the annotation depicts a nice retracement into the 61.8 levels and a commencing downward action. The bounce from the December low in the DXY was seemingly encouraging for the Dollar but it has not developed sufficient upside momentum to keep the upside in play. A failure at the 61.8 Retracement is indicating a slight downward bias to the dollar in the coming weeks. If this translates into some concomitant strengthening of the INR, it could turn out to be a continued rise in the Nifty and this is another element to watch in the coming sessions.
A good revival was seen in Metal stocks in the last week. Chart 4 shows the CNX Metal index where a forceful upward move is suggesting a breakout to a new high, which is always a good signal for continuation of moves in component stocks.
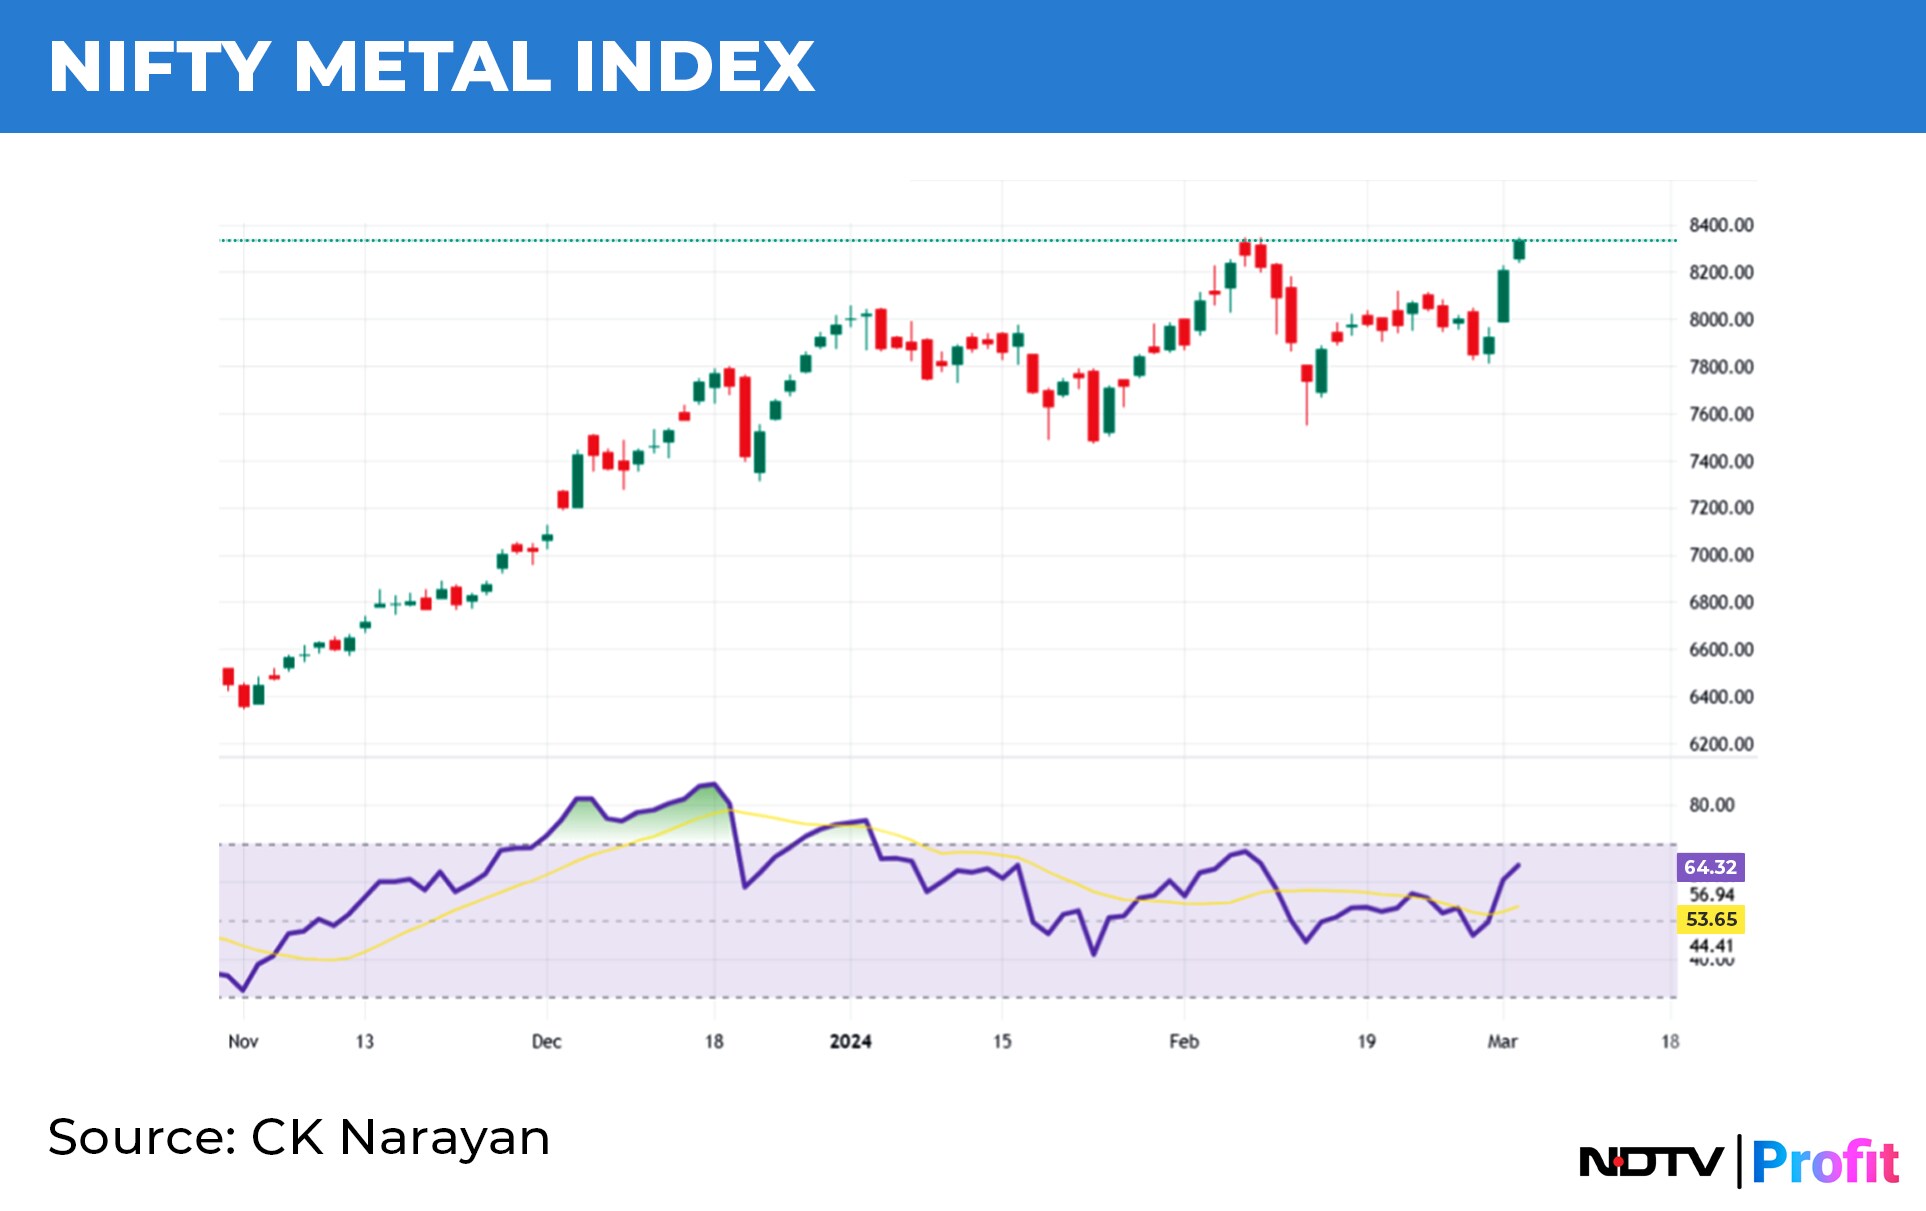
Doing a Relative Strength analysis, I find that improvements in the trends of Tata Steel and JSPL are the most notable and I would expect that the strength in them ought to continue. Therefore, the long plays in these two names should be considered particularly during intra week dips if any.
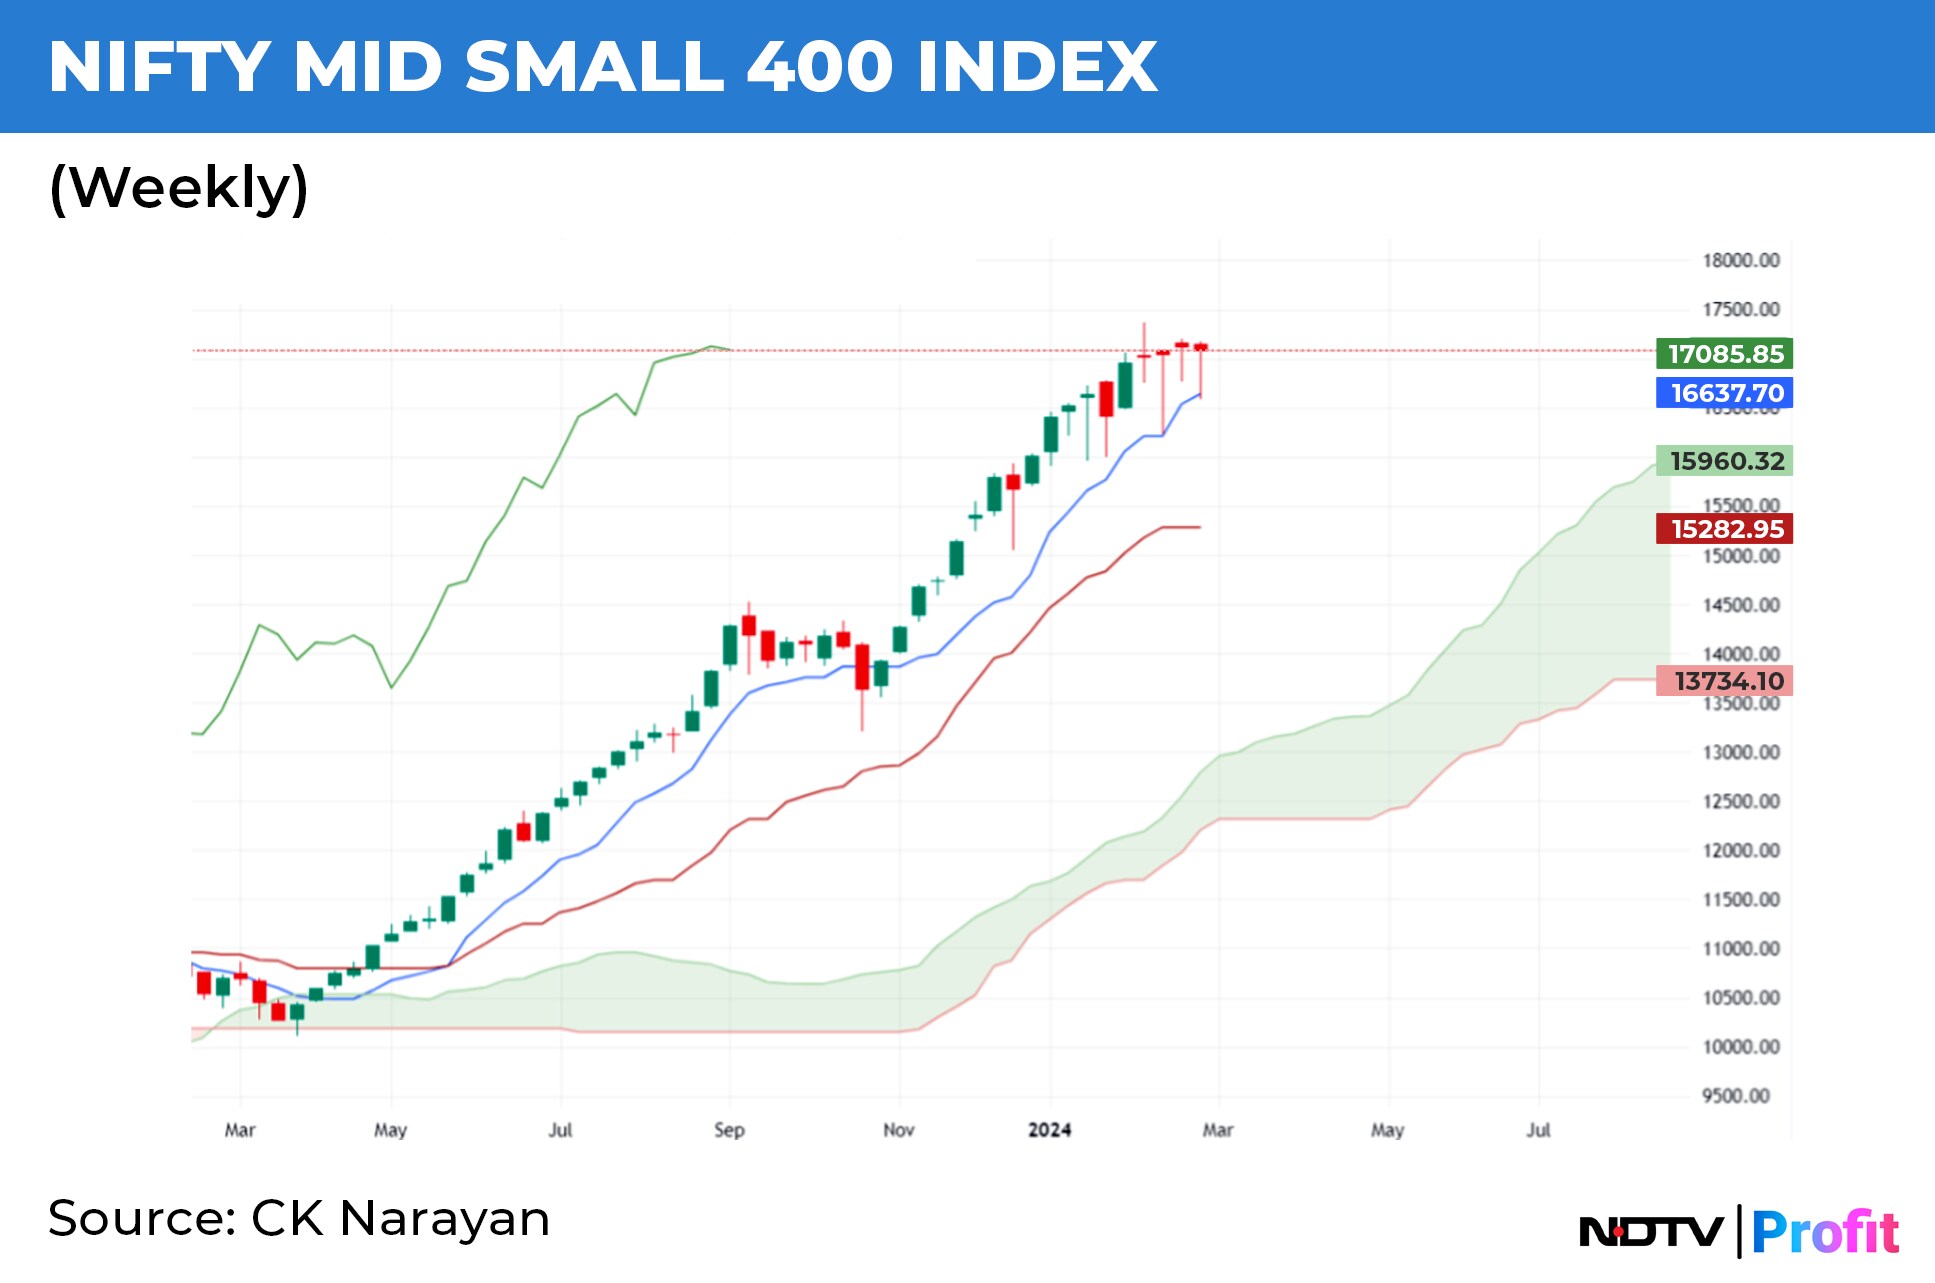
Sentiment in our markets is most ruled by the state of health of retail portfolios. Since those are dominated by small and mid-cap stocks in general, the corrective phase since Feb. 8 would have proved to be a small dampener. Recall that the first of our turn dates for the month of February was on the 9th and the sentiment indicating that the mid and small-cap index turned on that date even as the large-cap indices carried into the second date on Feb. 23. But, looking at the chart of Mid Small 400 (Chart 4 , Weekly), we find that the 'the correction' was very mild as evidence by the fact that the weekly candles were all small-bodied affairs with lower shadows and the move could not even penetrate beneath the TS line of the Ichimoku system.
Usually, when a strongly trended move continues to take support from the TS line, the strength of the trend tends to persist. In that context, the revival of the trends seen in the last week may herald a revival of sentiment in the mid and small-cap area, which should boost the Nifty movement towards the suggested target of 23,200.
Summing up, the thrust to all-time highs seen at the end of last week has a high probability of a continuation ahead. The small caveat is for the time cycle for Monday to be crossed. The supportive evidences by way of momentum, sentiment favoured sectors (Metals and possible revival in small and mid-cap segment) should enable us to hit new highs at 23,200.
CK Narayan is an expert in technical analysis, the founder of Growth Avenues, Chartadvise, and NeoTrader, and the chief investment officer of Plus Delta Portfolios.
The views expressed here are those of the author and do not necessarily represent the views of NDTV Profit or its editorial team.
Essential Business Intelligence, Continuous LIVE TV, Sharp Market Insights, Practical Personal Finance Advice and Latest Stories — On NDTV Profit.