The way the market has been moving, one wonders where the Bears are. We look around, and we don't find them! Because, the true-blue bear is missing. Instead, we have the diluted version of the Scared Bull who is intermittently playing the role of a bear! How's this possible, you wonder?
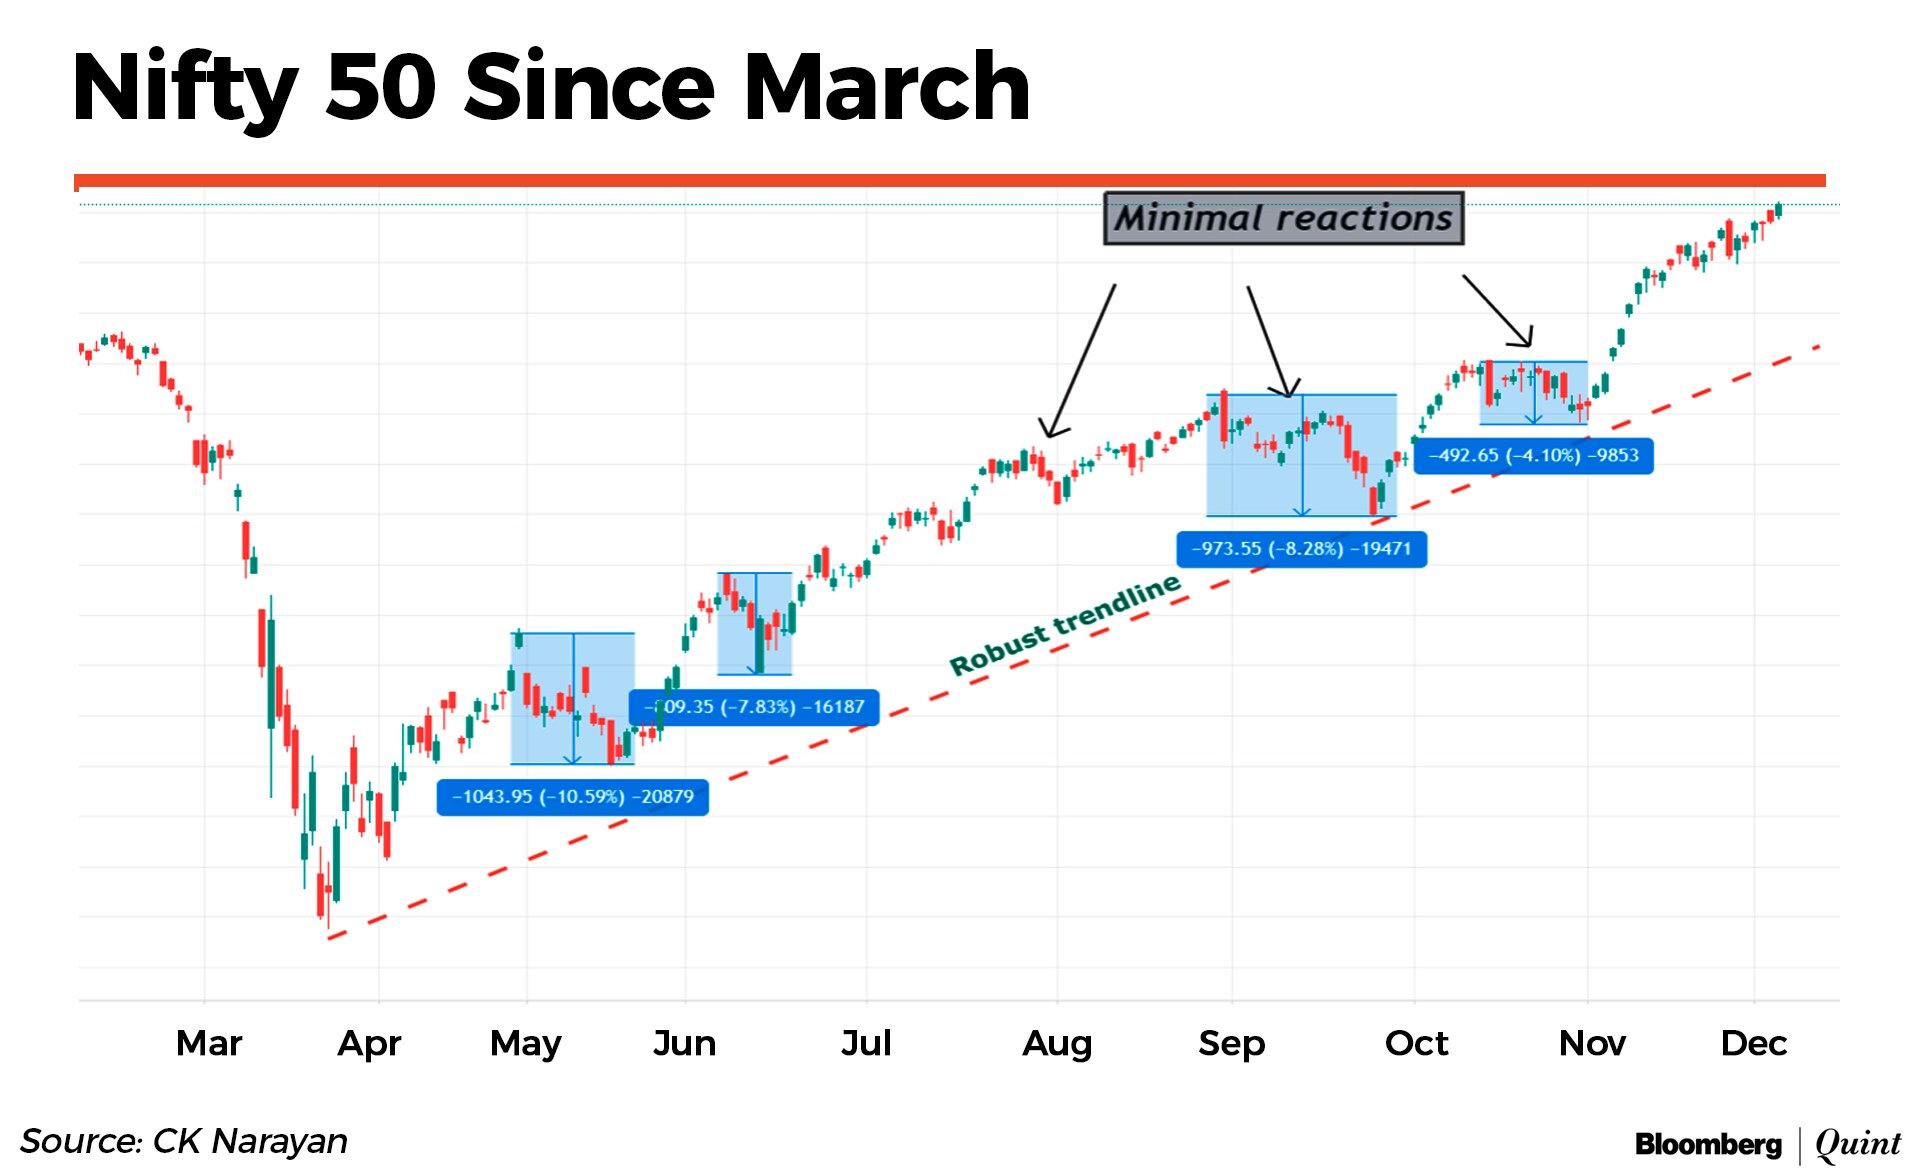
It is quite simple, actually. To the last man, everyone was bearish when the markets turned around from the March bottom. The rally into mid-April was taken as an oversold bounce. It was therefore dutifully sold into. But hints of something else afoot came in the surge from May to August. Most missed the rally because they couldn't ‘buy at the bottom'! This kept many just punting every now and then in the markets with most ready to hit the Sell button on any sign of trouble. The reactions, as and when they came, therefore, led to a quick liquidation of the positions.
Very soon thereafter, those very same sellers turned buyers once again. This cycle repeats into the current date and even as cycles have become even smaller (sometimes confined to intraday dips only), the fact that the prices keep jumping up to ever new higher highs, makes the erstwhile sellers turn buyers once again. So, it is really the buyers (i.e. Bulls) who turn into bears, and then they are being forced to turn into bulls again. And repeat the cycle.
The question is, how long will this last? Well, it seems to me that so long as the liquidity tap is left on (read FII flows), the larger players are not going to let go of their positions. The higher the market goes, the more nervous the general public becomes! They question every element, believing that the turn is right around the corner. But the market awash with liquidity does not permit that turn to come as yet.
When evidence of the flow tapers off, we may find the long-range players either not buy dips of the future or they may join the selling.
This will be a change in pattern and that is what gets captured on the charts. So far, the pattern is intact in the Nifty. Indeed, in the Nifty Bank, the pattern signalled some intent to continue higher at the end of the week! In the chart of Nifty Bank, it can be noted that the buy signal (blue arrow) that occurred around early October has remained intact even though the prices, over the last 10 sessions, have been range-bound. On Friday, however, we saw an upward thrust out of the consolidation that now promises more gains in the week ahead.
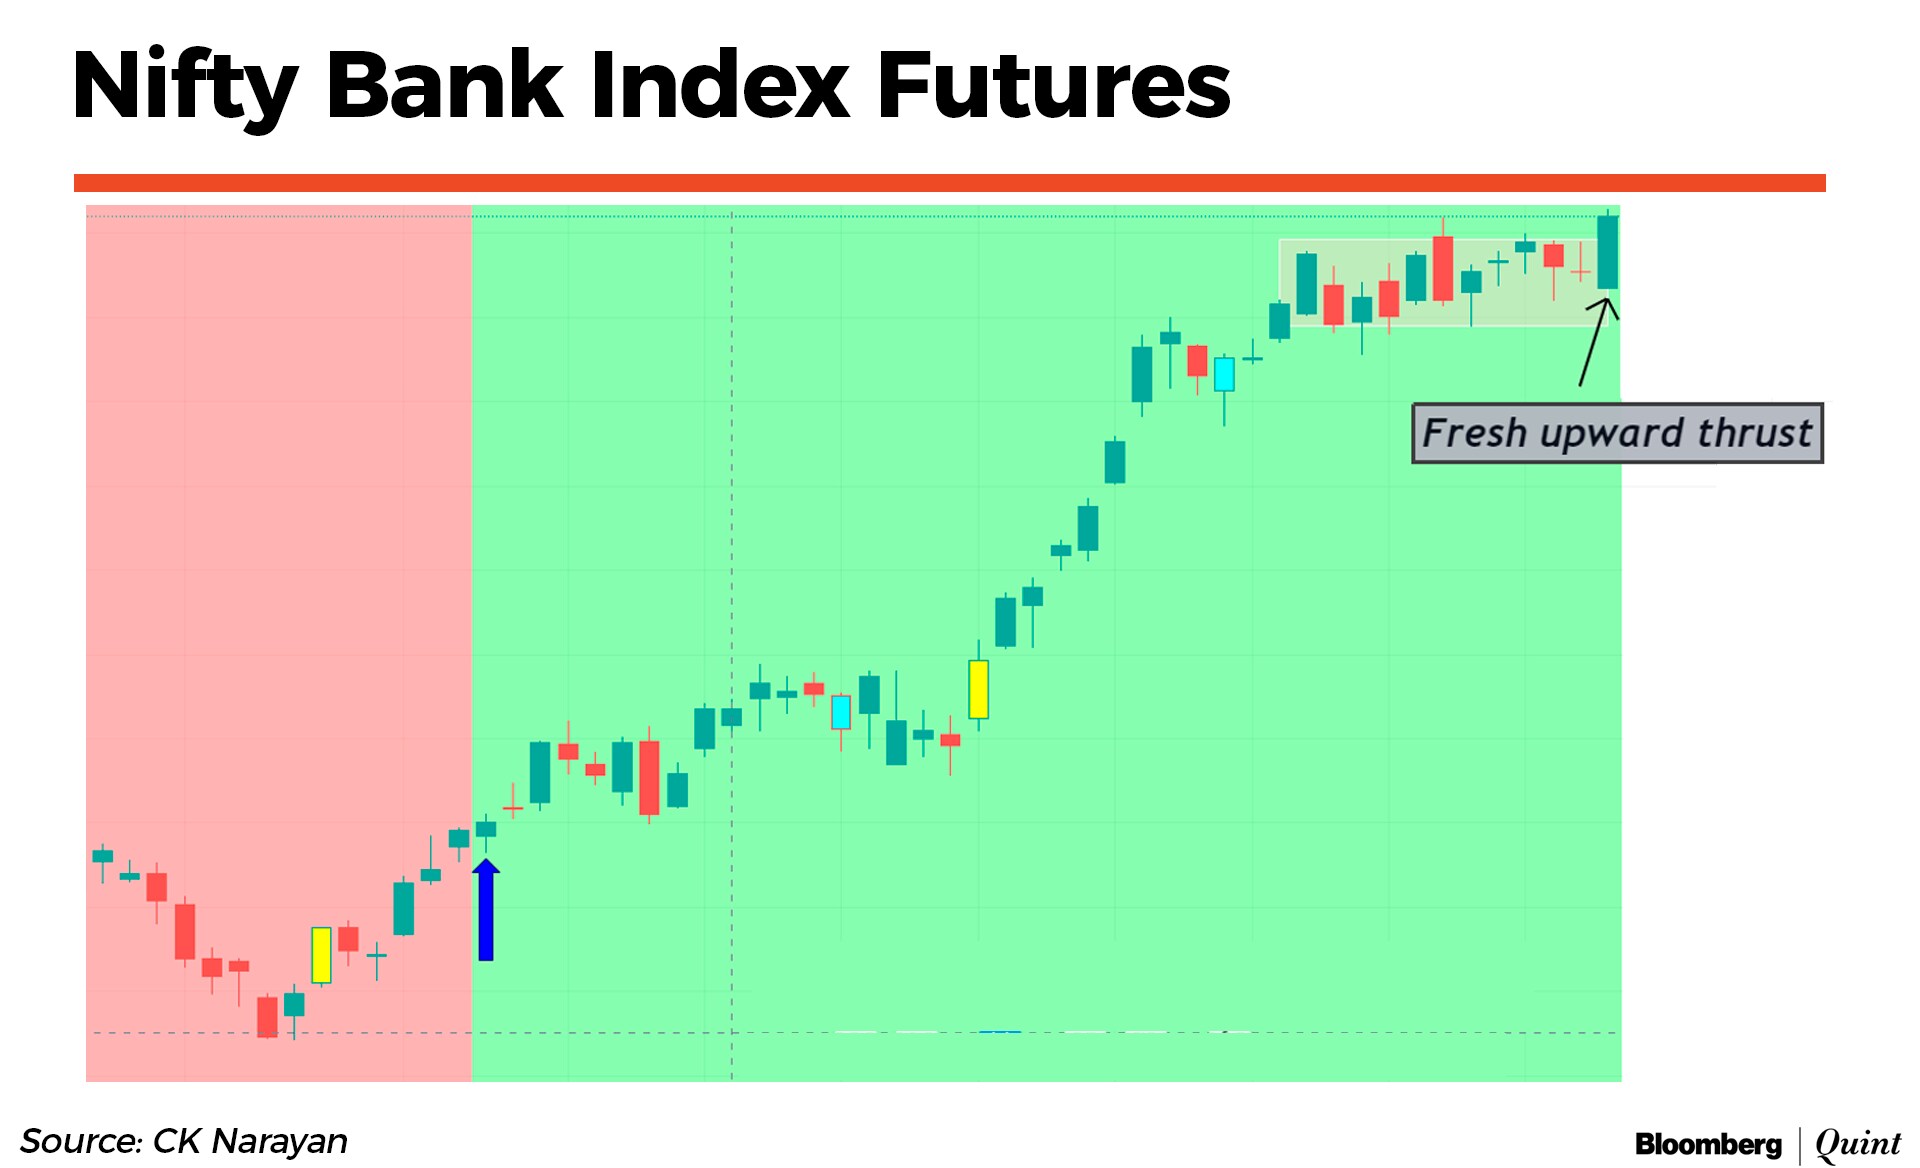
The Nifty Bank trends have been dragging that of the Nifty ever since March and perhaps this upward thrust can now enable the Nifty Bank to post a new high above the January 2020 highs too. This is something that the market shall be looking for in the week ahead.
Some of the sectoral indices have performed spectacularly in recent weeks. The table below shows the list of sectors that have continued super performances into the current month after putting up a great show in November.
Now, it is interesting to see that all these sectors were down and out earlier and hence the big recovery in them (monthly) was probably owing to short-covering and value buying. That all of them have continued to fare well in the first week into December suggests that the buying continues and hence the bigger rally now seems to be broadening out in terms of sector participation. Earlier, if readers recall, the rally was largely championed by banks, IT, and pharma.
Widening breadth is a feature that suggests that positive sentiments may continue. However, it is interesting to note that despite the index hitting all-time highs, the number of people wanting to get in is still very low!
Back in 2016-17, my phone wouldn't stop ringing and now, even at new highs, I hardly get any calls from people outside the market asking whether they should invest!
I think, beyond all other points, this is the biggest pointer to the amount of scepticism that still exists among the people at large. Hence chances that the market may undergo a substantial reaction seem quite low.
So, if big declines have not been seen so far—worst has been 10% or so—and seem unlikely for the near future, then we should continue to see similar, limited reactions in the market. We need to keep watching those to see if any of those reaction legs develop any heft. WD Gann had called an overbalance of price and time (measured through swings) as a signal of change of trend. Until that arrives, we should continue to remain buyers on dips. Trading breakouts is a game for traders and they need to continue doing that, using lower time frames to spot the consistency of the trend.
CK Narayan is an expert in technical analysis; founder of Growth Avenues, Chartadvise and NeoTrader; and chief investment officer of Plus Delta Portfolios.
The views expressed here are those of the author, and do not necessarily represent the views of BloombergQuint or its editorial team.
Essential Business Intelligence, Continuous LIVE TV, Sharp Market Insights, Practical Personal Finance Advice and Latest Stories — On NDTV Profit.


