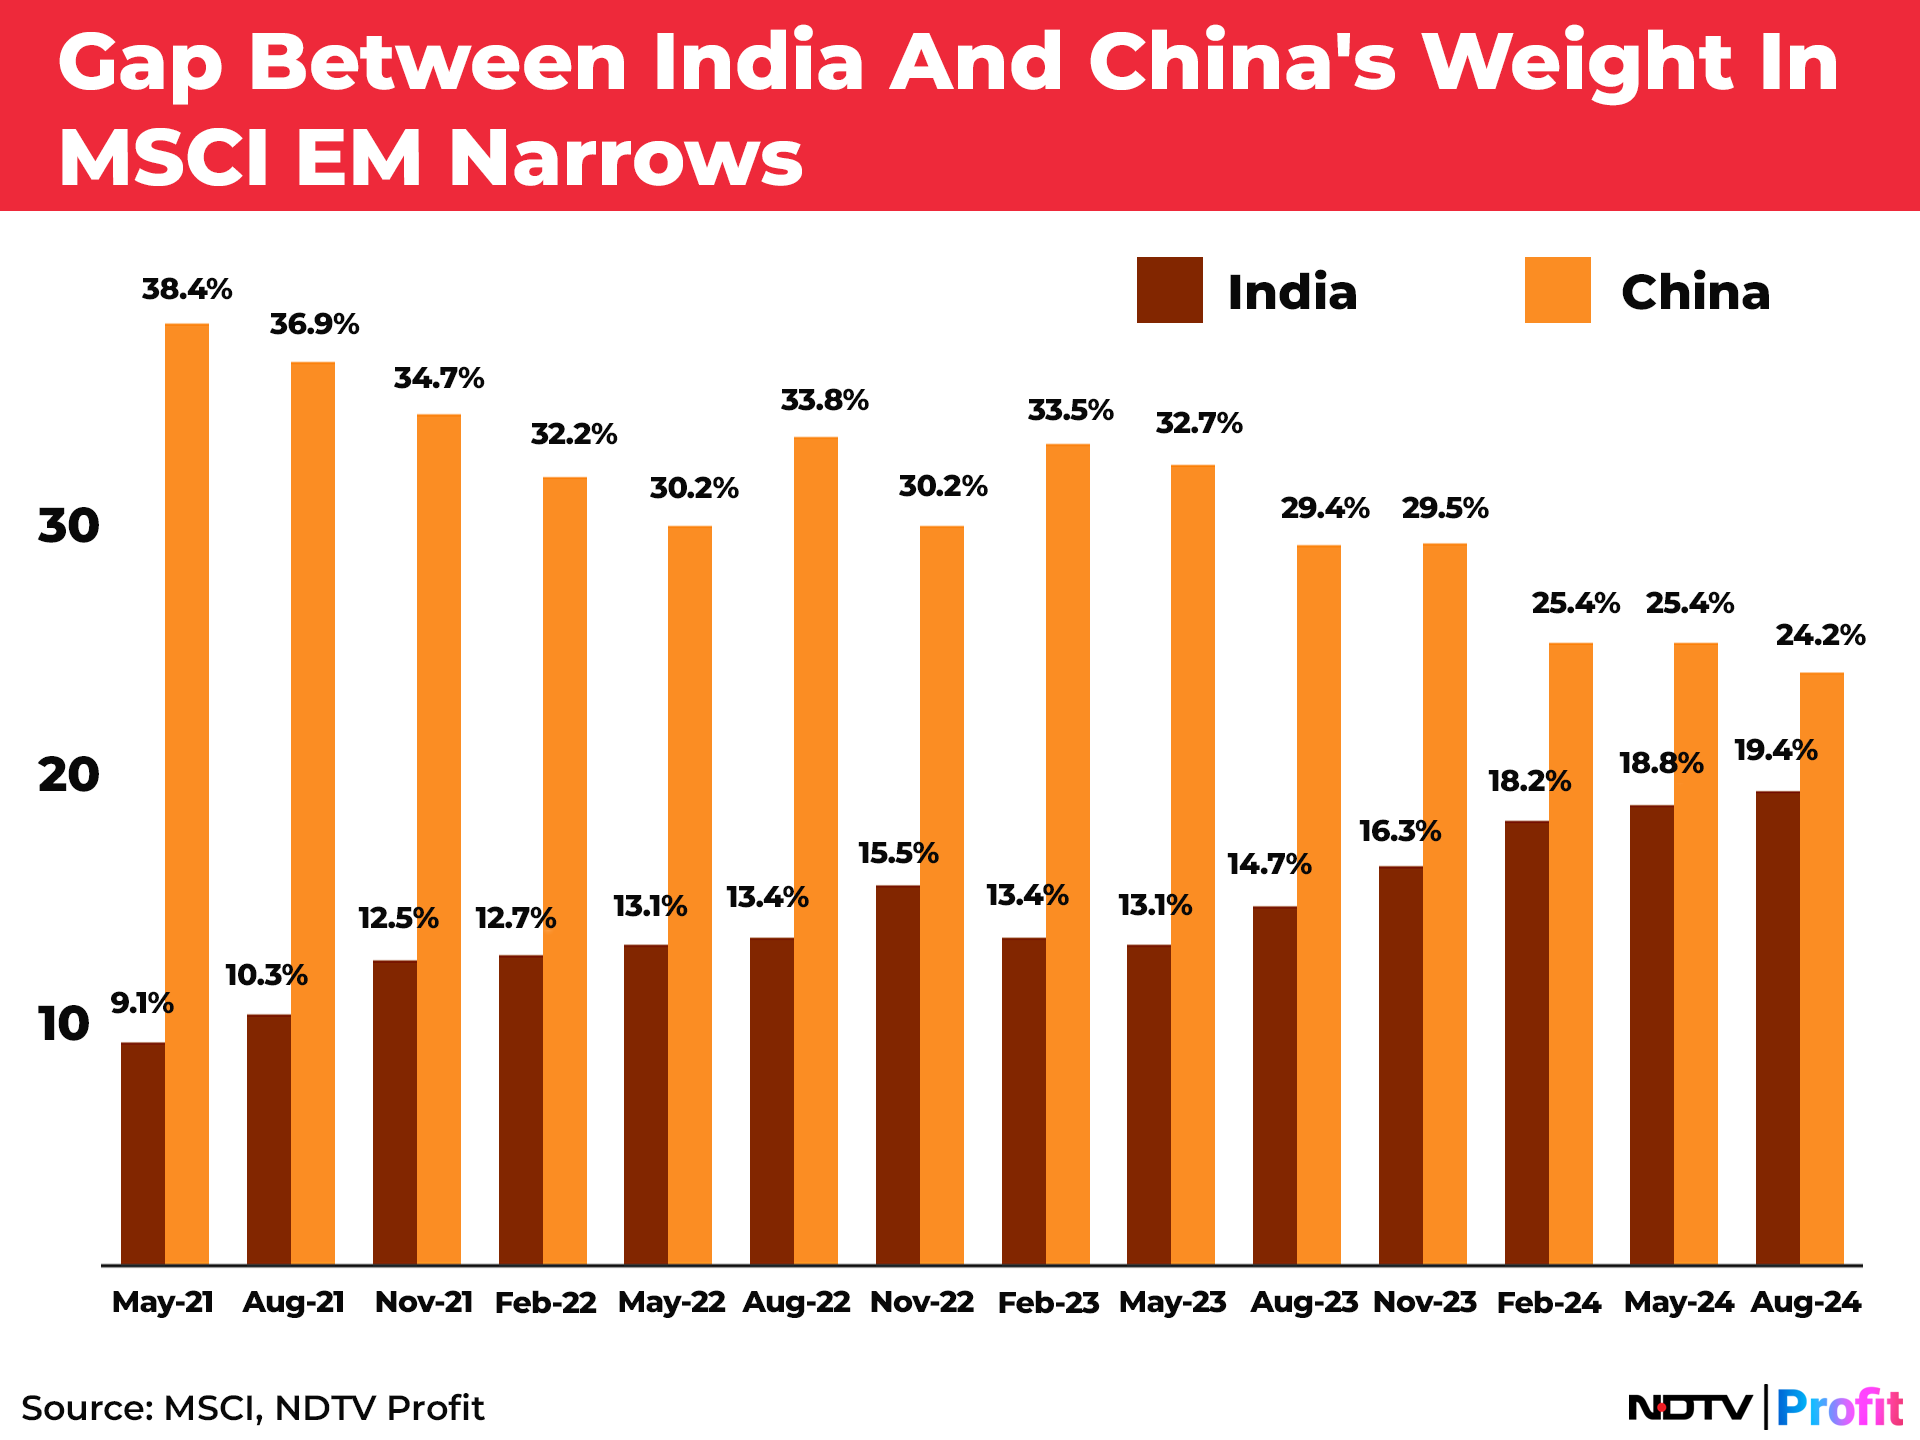
The gap between India and China's weightage in the MSCI Emerging Markets index narrowed further during the August revision as the international index maker increased India's weight for the fifth quarter in a row.
China, on the other hand, has not seen a weightage increase in eight revisions or two years. India's weight now stands at 19.4%, while China's is at 24.2%.
Even as India's weight in the MSCI EM index has doubled in a three-year period, flows made by foreign portfolio investors have remained muted.
Cumulative flows made by FPIs stand near Rs 59,000 crore, while those made by domestic institutions near Rs 8.4 lakh crore, outweighing foreign ones by over 14 times.
Flows made by domestic institutional investors include a substantial contribution made by the retail segment, investing indirectly into equities through mutual funds.
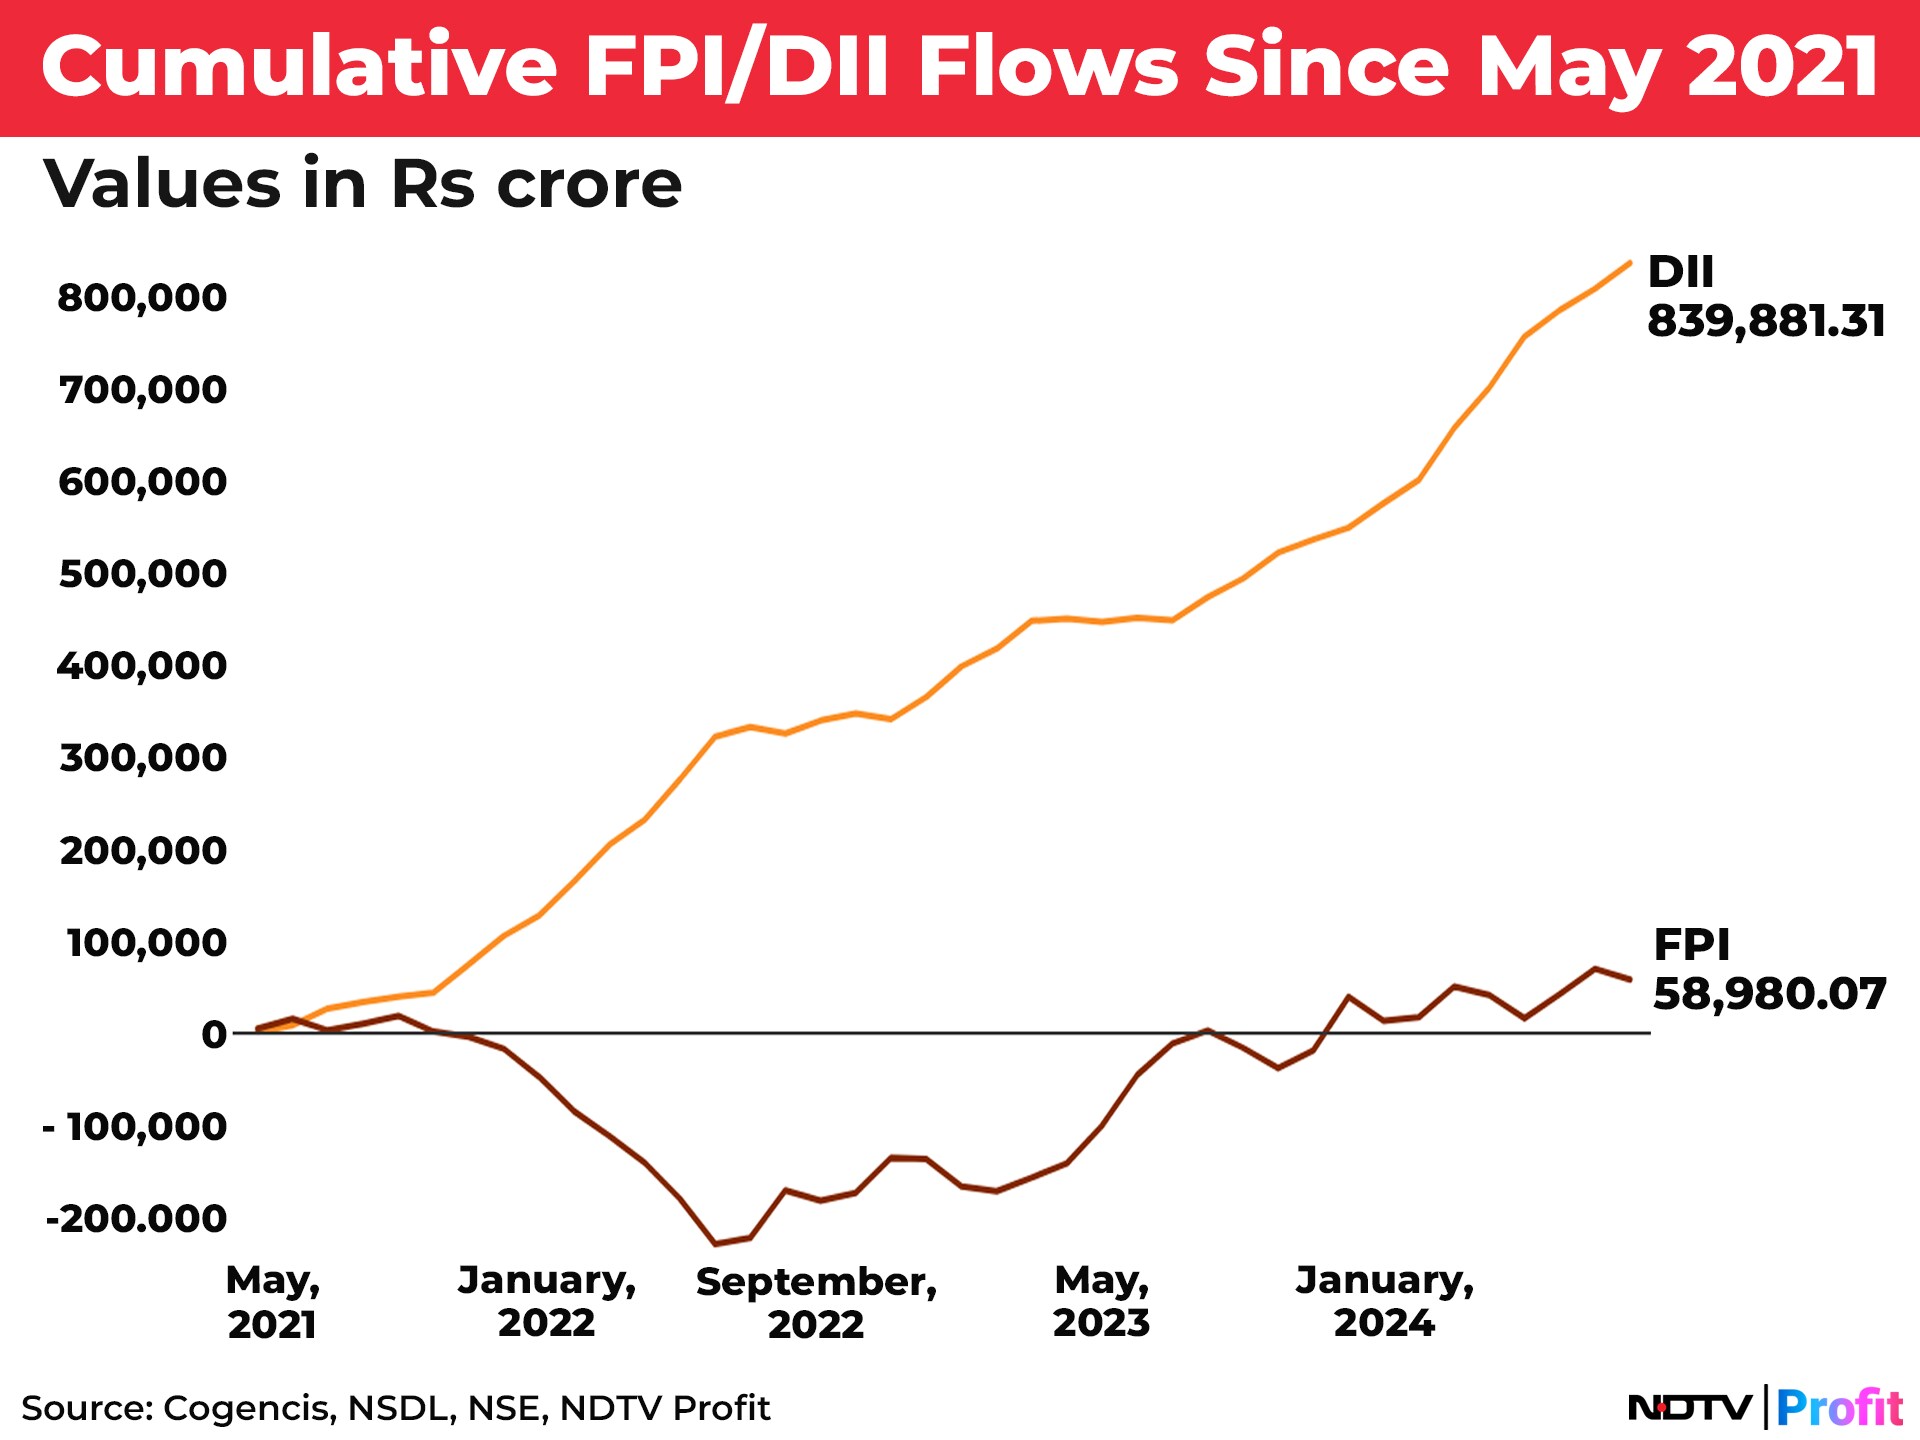
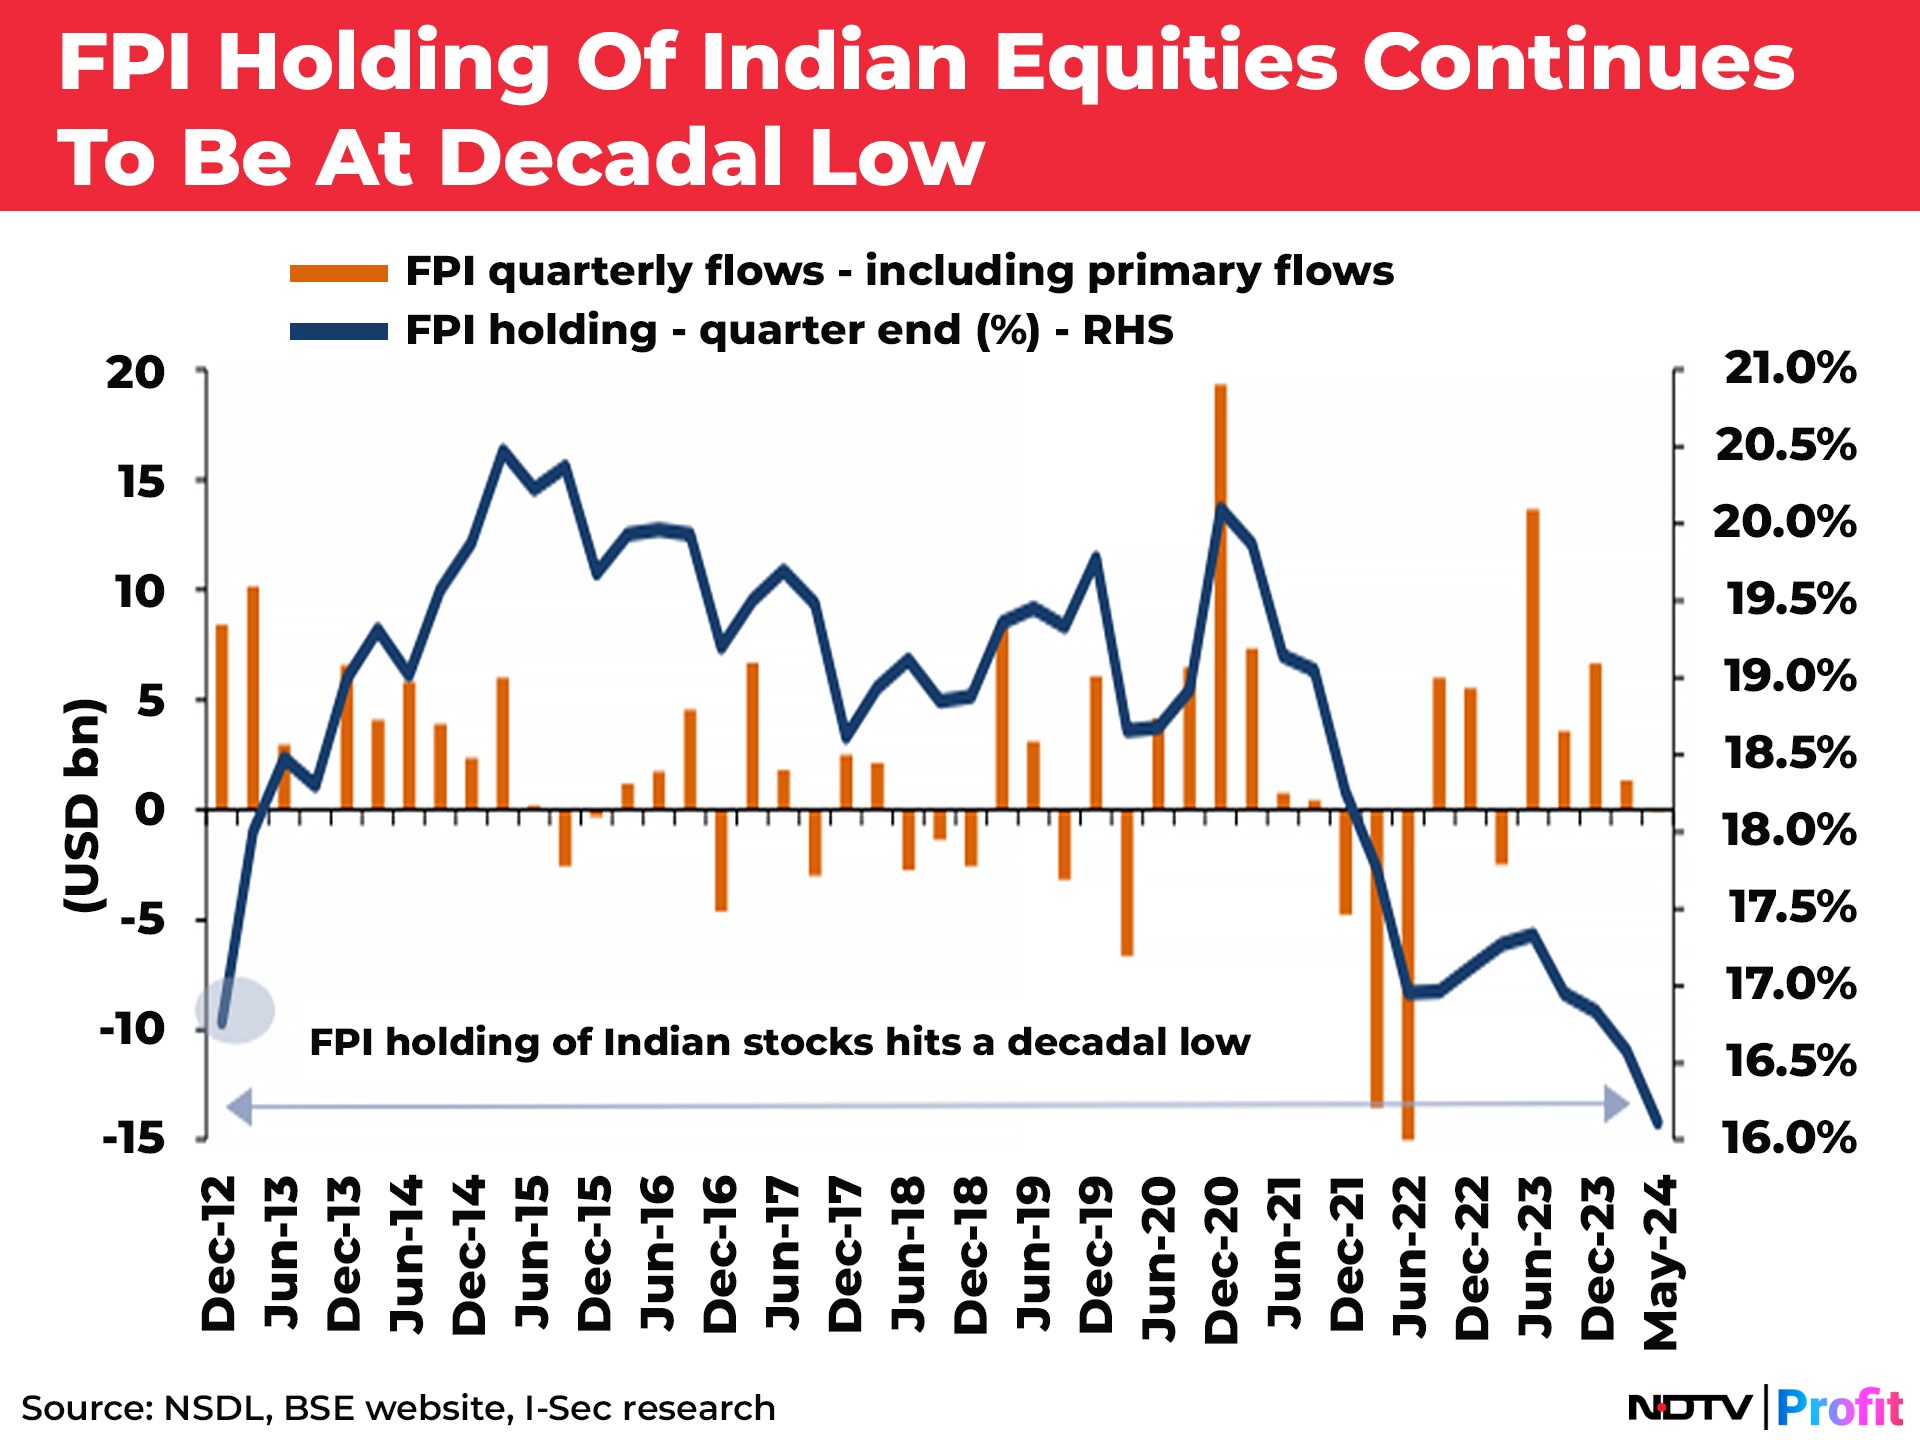
As domestic participation in equities has grown, foreign ownership in the Indian market has dwindled to the lowest in 12 years at close to 16%.
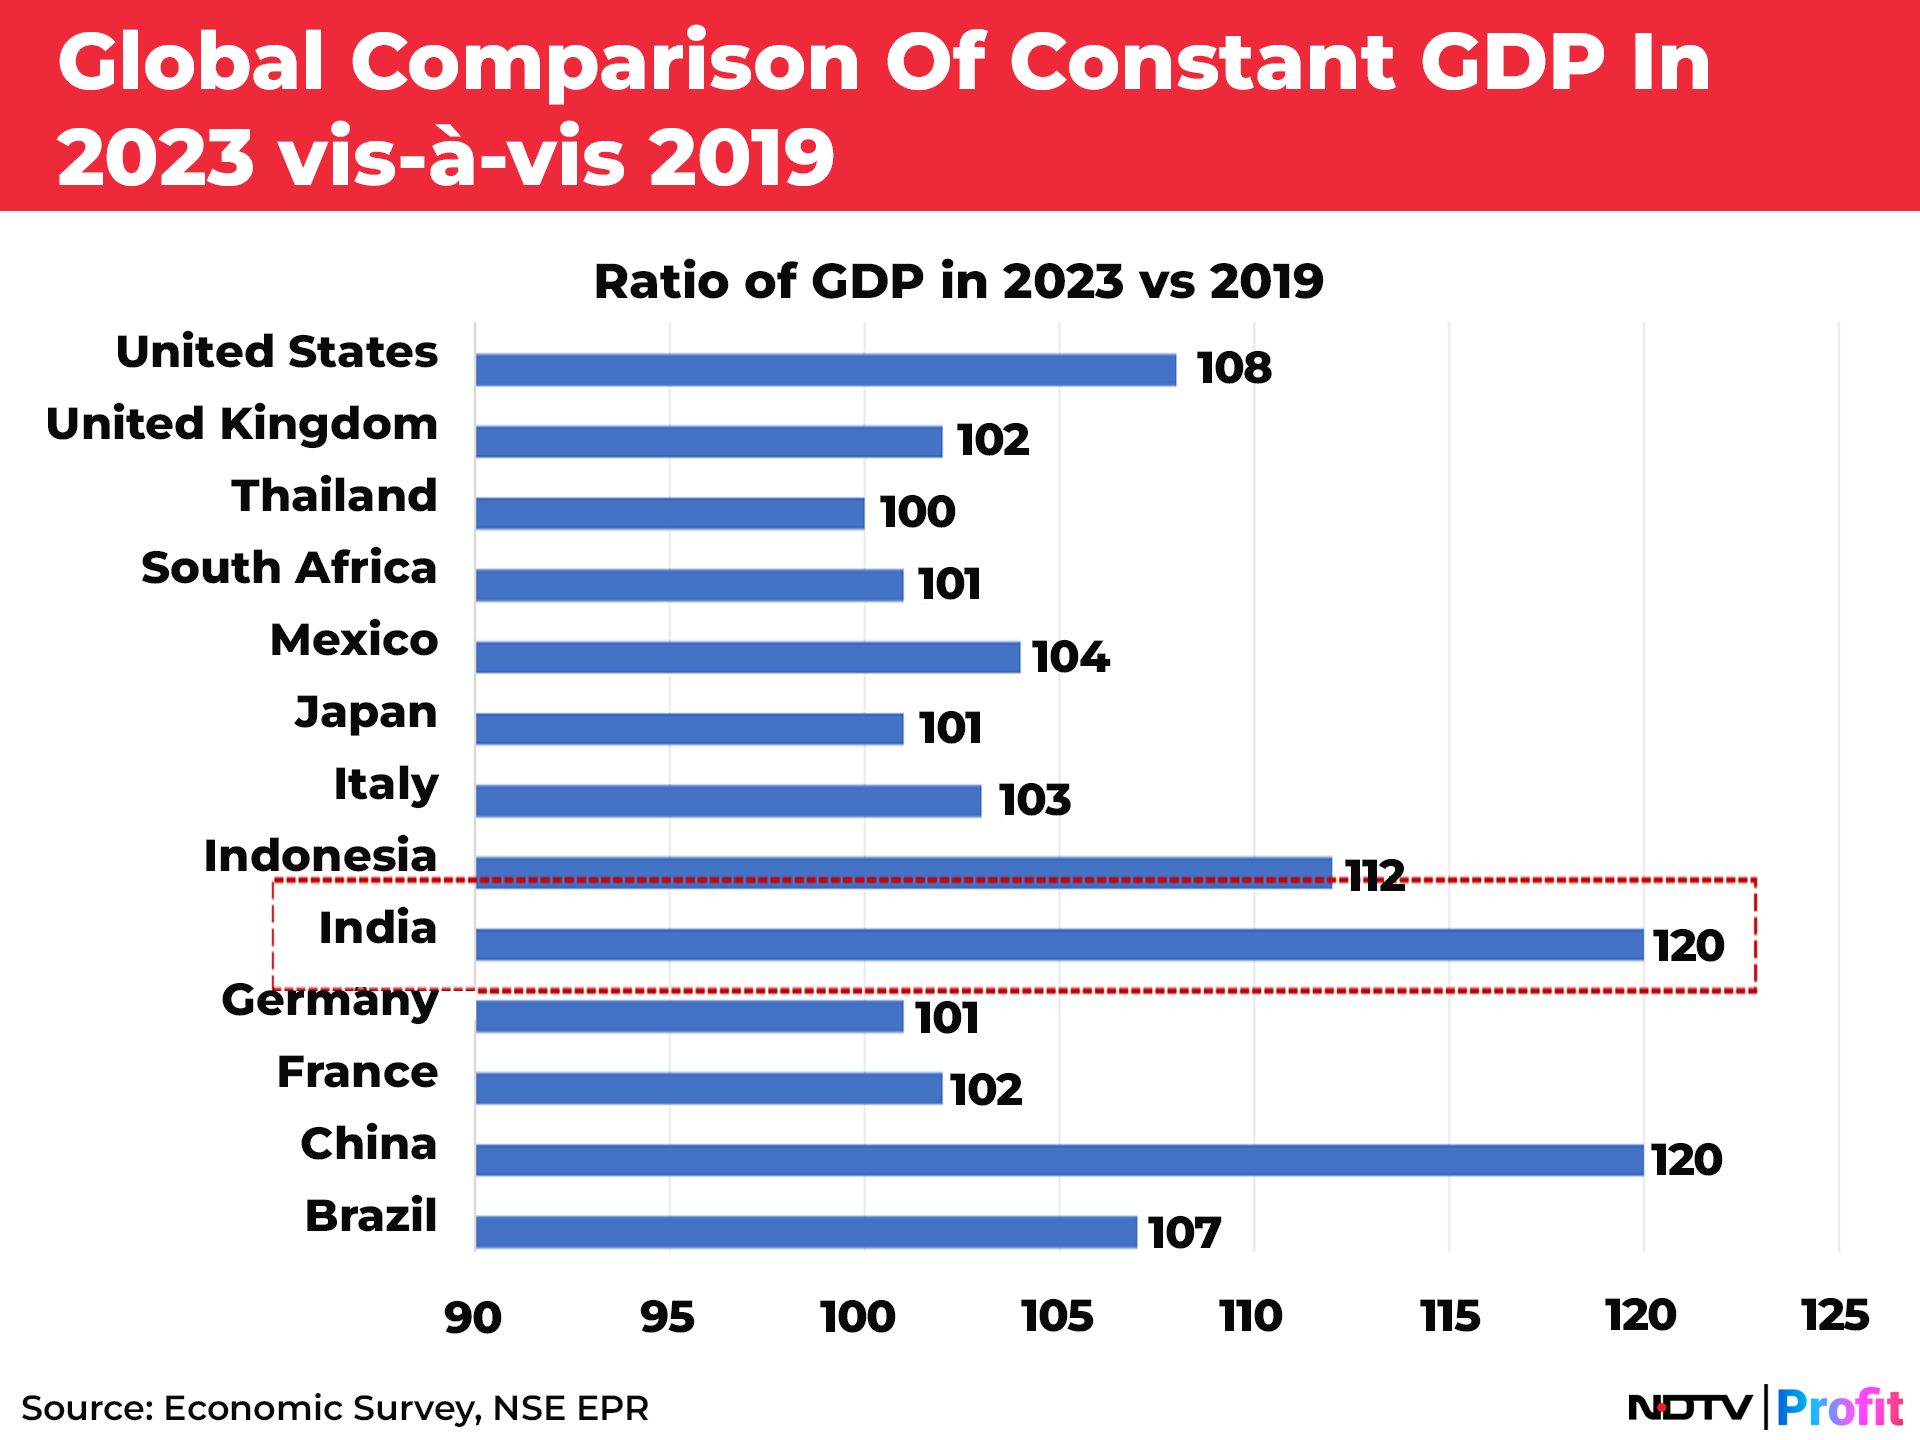
Since the pre-pandemic year of 2019, India's growth in gross domestic product has been mirrored by China, with the ratio of the two nations' GDP for 2023, when compared against 2019, standing at 120.
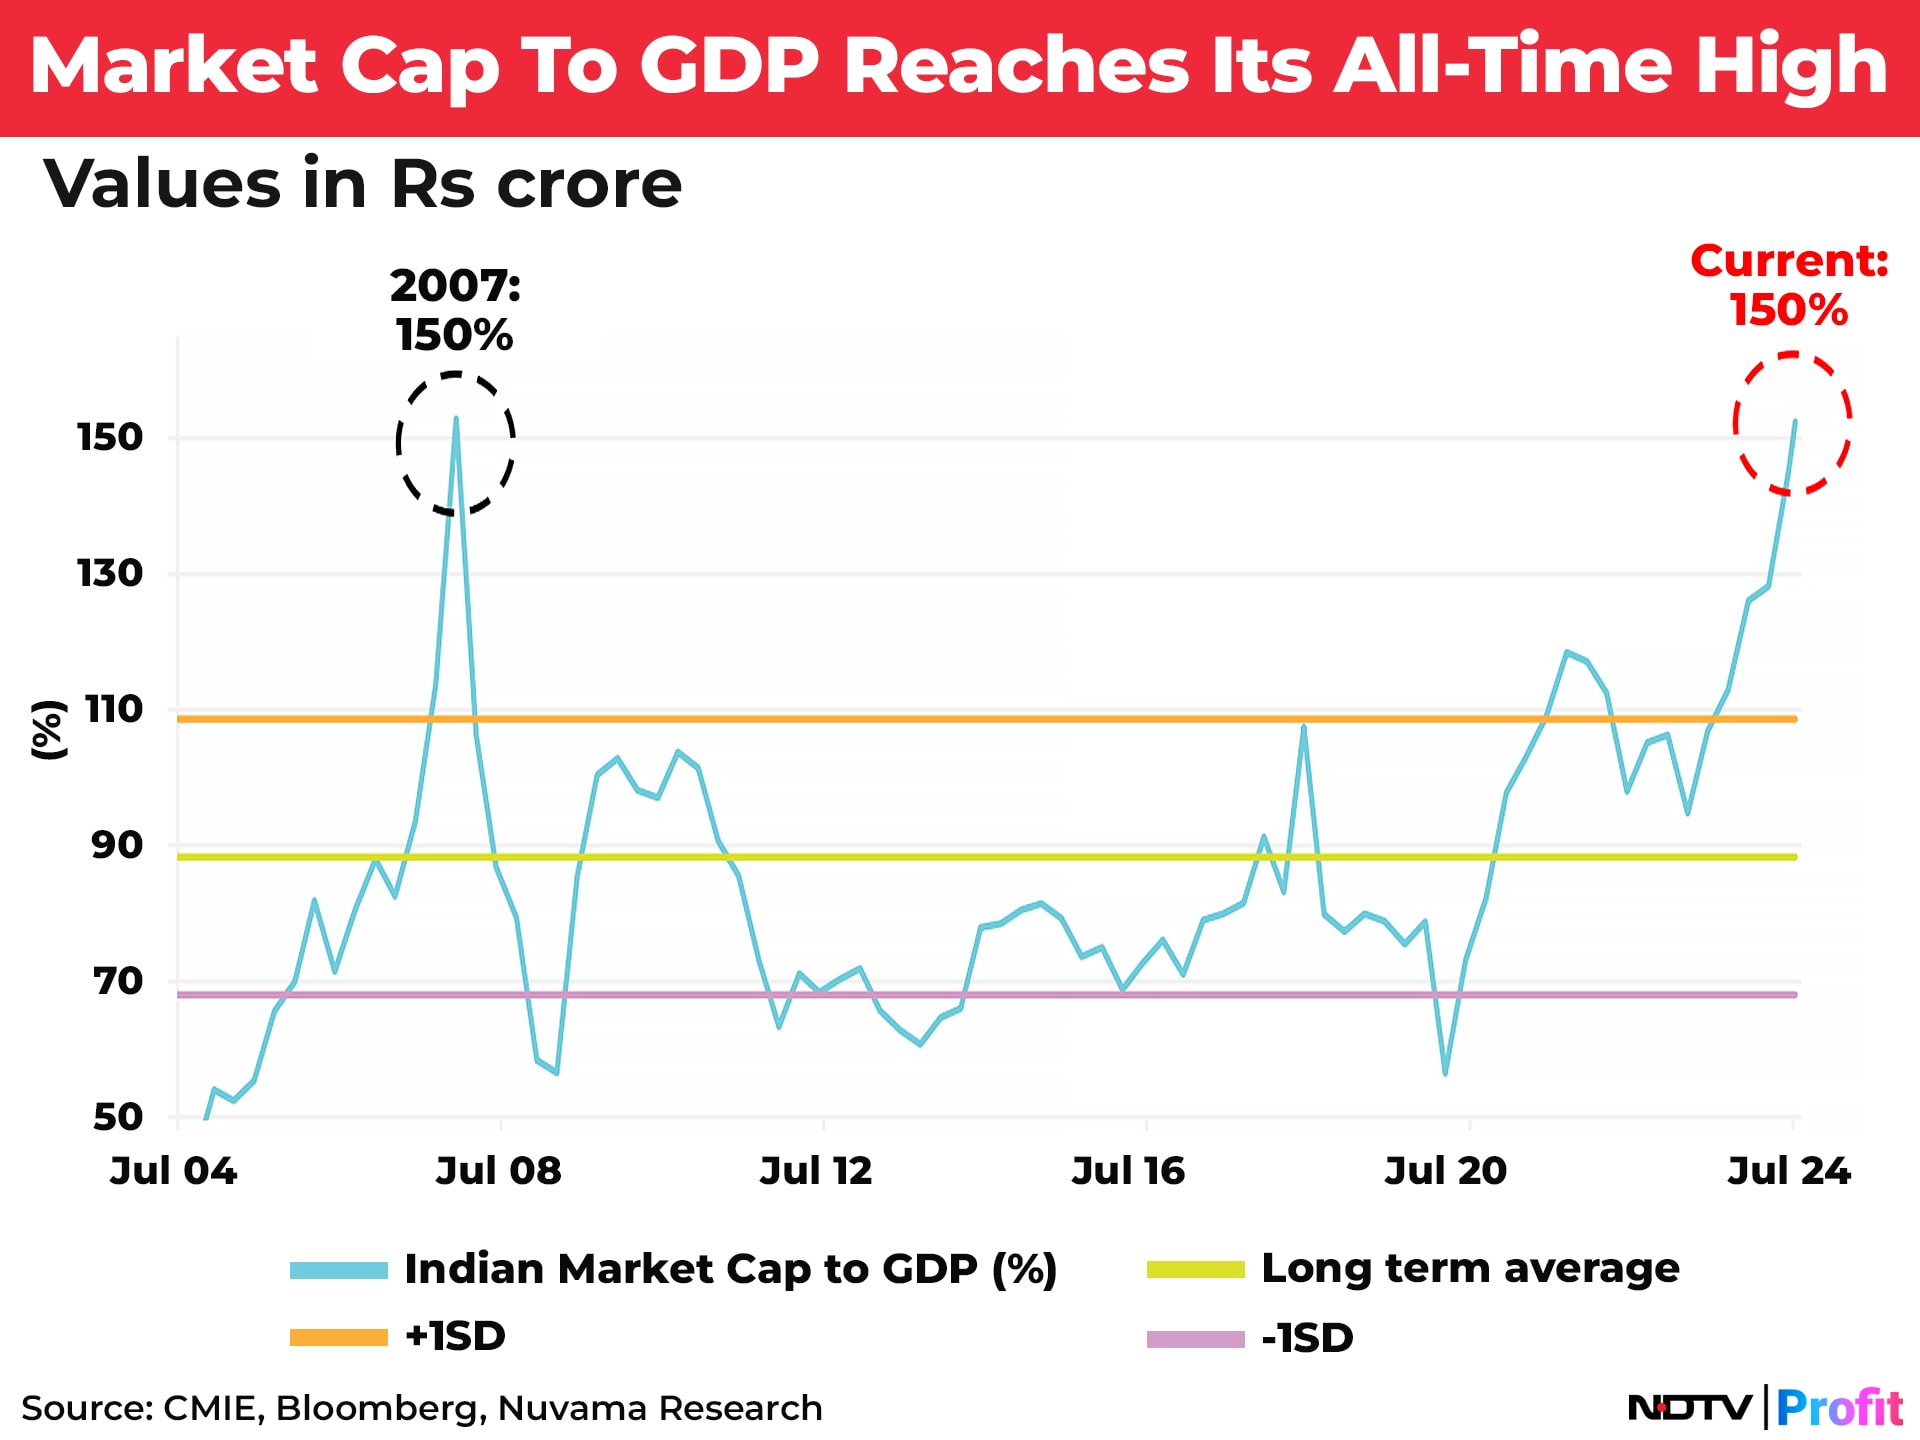
The Buffett Indicator, named after the market veteran, is the ratio of the total equity market capitalisation of a country, compared against its GDP, has neared its lifetime high of 150% for India, as equities staged a relentless rally since the post-Covid lows.
Indian markets benchmark Nifty 50 has grown to triple the value from the lows it hit amid the Covid-19 crash.
The current ratio of market cap to GDP is its highest level since 2007, the year before global equities crash due to the global financial crisis.
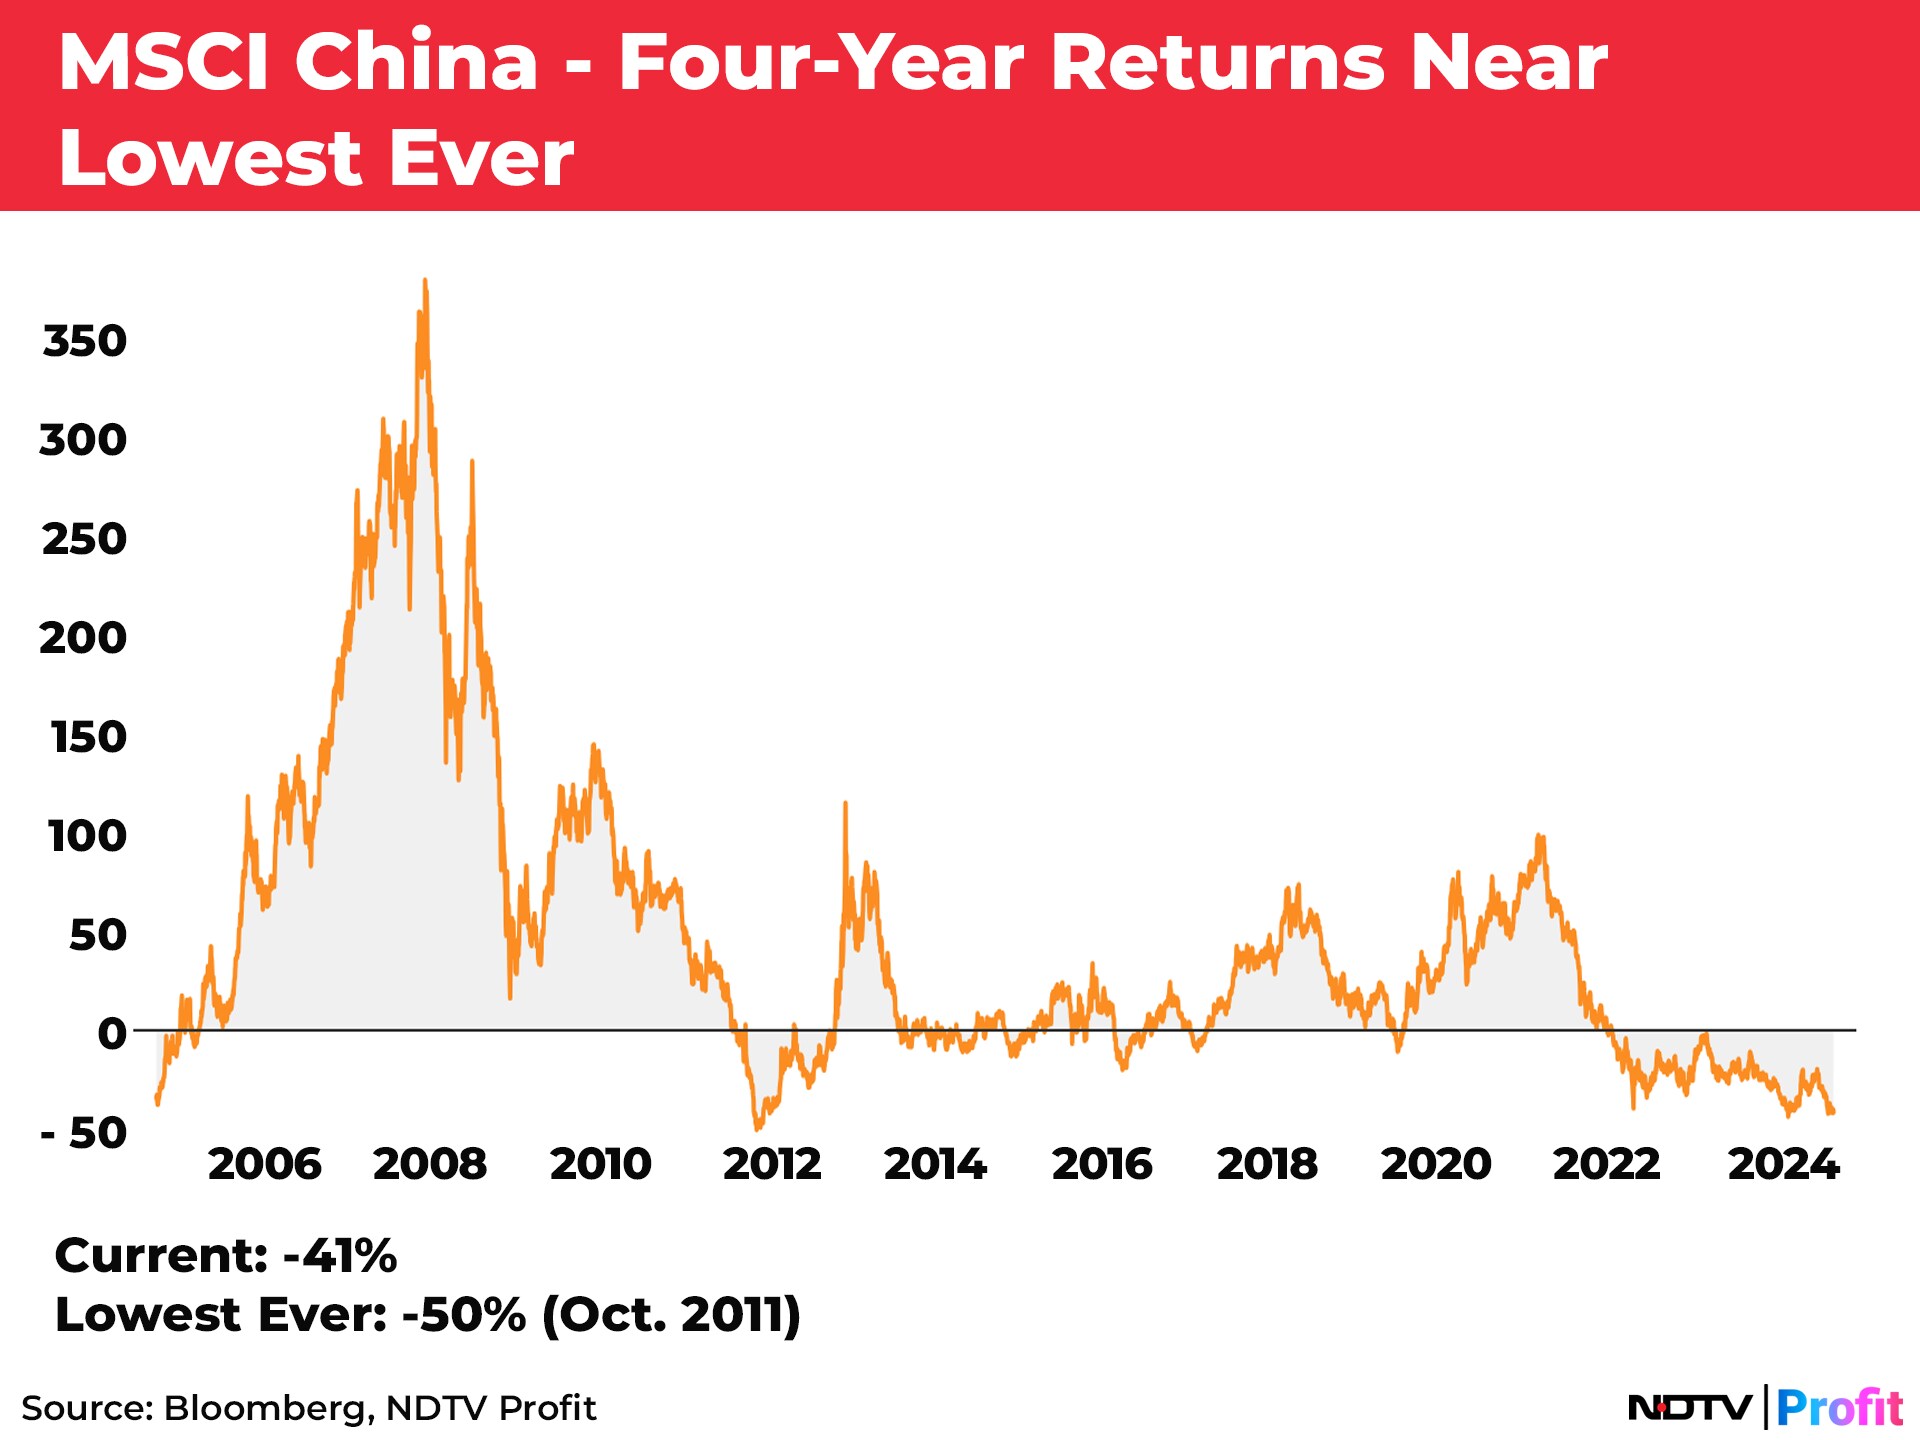
MSCI China index has neared its lowest point based on four-year returns, all the while recording a growth in its GDP, implying that the market cap to GDP ratio for the country may be on a decline.
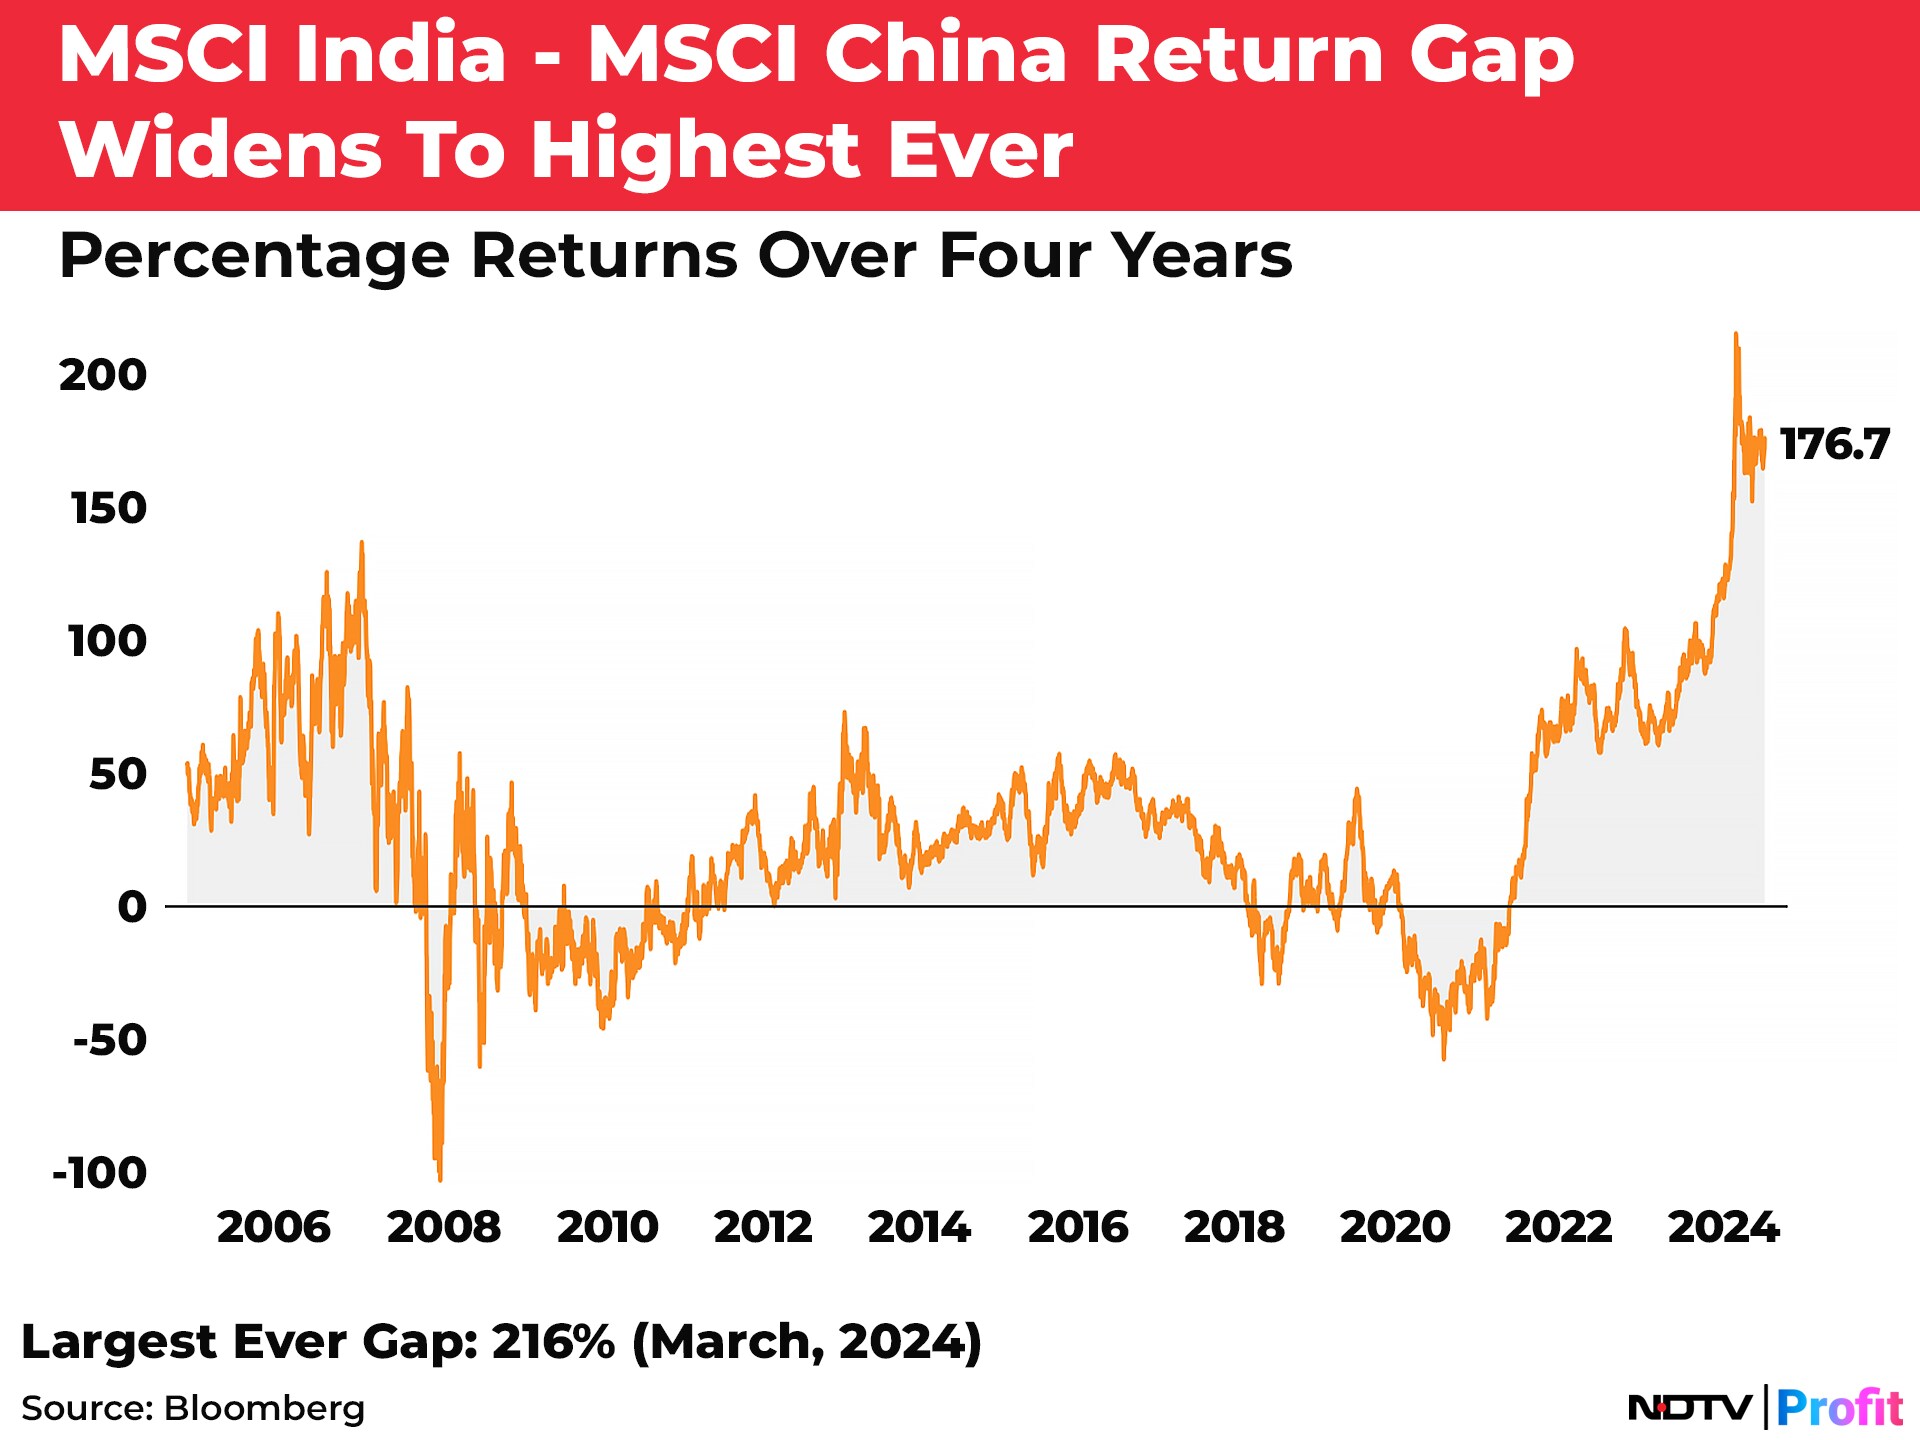
Comparing the four-year returns between the two nations' indices, the gap has grown to its highest ever, touching the highs of an over 200% difference in March, 2024.
Essential Business Intelligence, Continuous LIVE TV, Sharp Market Insights, Practical Personal Finance Advice and Latest Stories — On NDTV Profit.