


(Bloomberg) -- Copper inventories are swelling, while US crude stockpiles are continuing a streak of declines. European natural gas prices have rallied amid geopolitical turmoil, and two key US crops are expected to be coming in bigger than previously projected.
Here are five notable charts to consider in global commodity markets as the week gets underway.
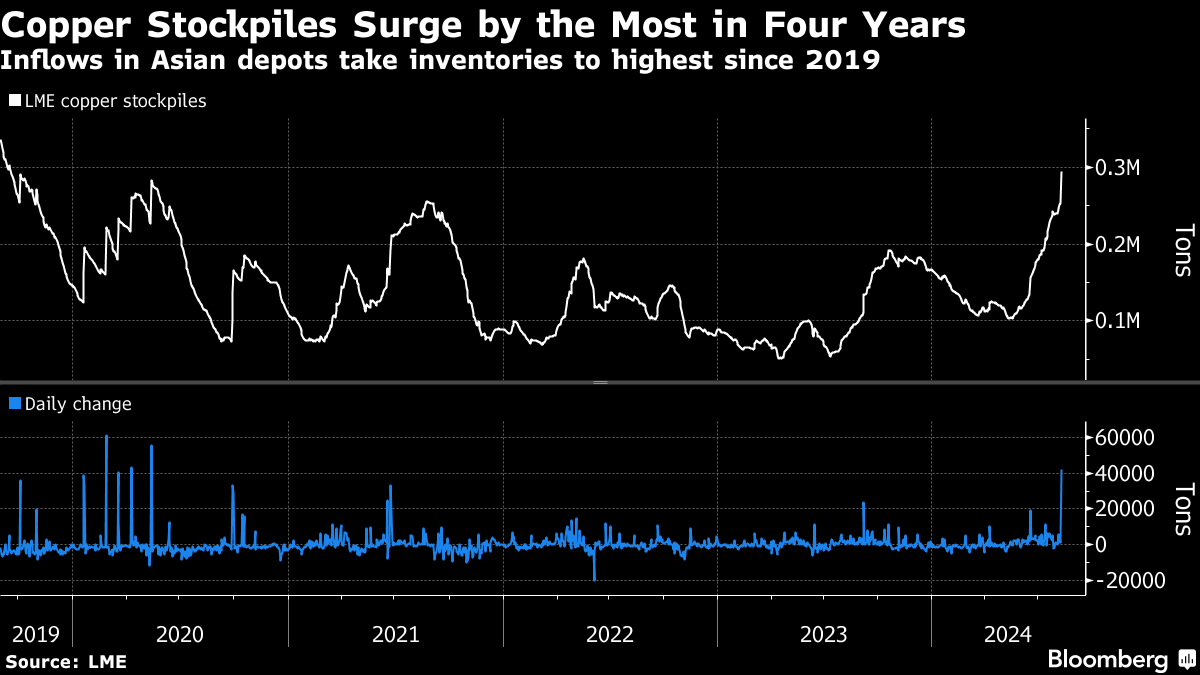
Asia Copper
Copper stockpiles on the London Metal Exchange surged by the most in four years, signaling weak demand in Asia. The 42,175-ton inflow took inventories to the highest since 2019, with the material flooding into locations in South Korea and Taiwan. That indicates tepid consumption in China, where the LME has no warehouses. While such big moves can sometimes be driven by commercial motives disconnected from underlying supply and demand, the overall buildup in recent months strongly suggests an oversupplied market.
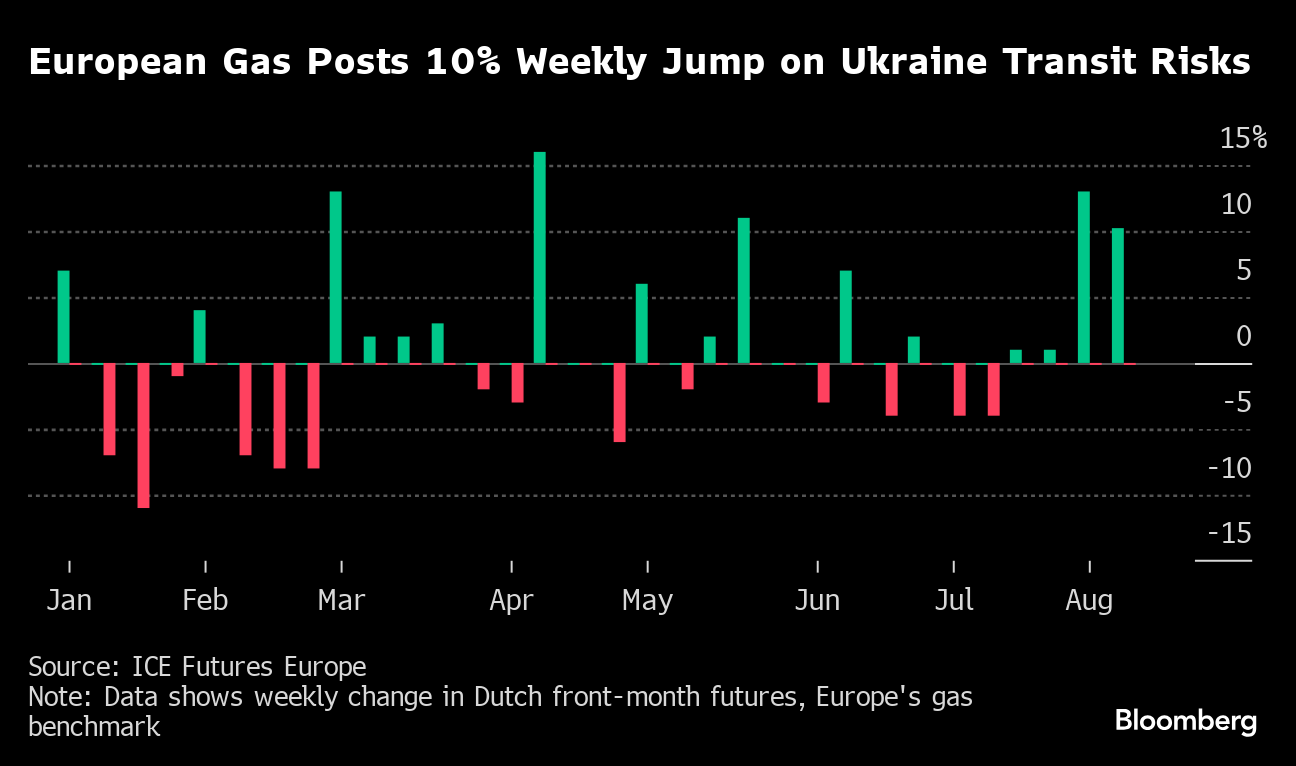
European Gas
European natural gas prices are staging a rally with two consecutive double-digit weekly advances. An incursion by Ukraine into Russia's bordering Kursk region last week put a key gas transit point at risk. Some European countries, including Austria and Slovakia, rely on Russian gas crossing Ukraine even if Europe as a whole has moved to diversify supplies.
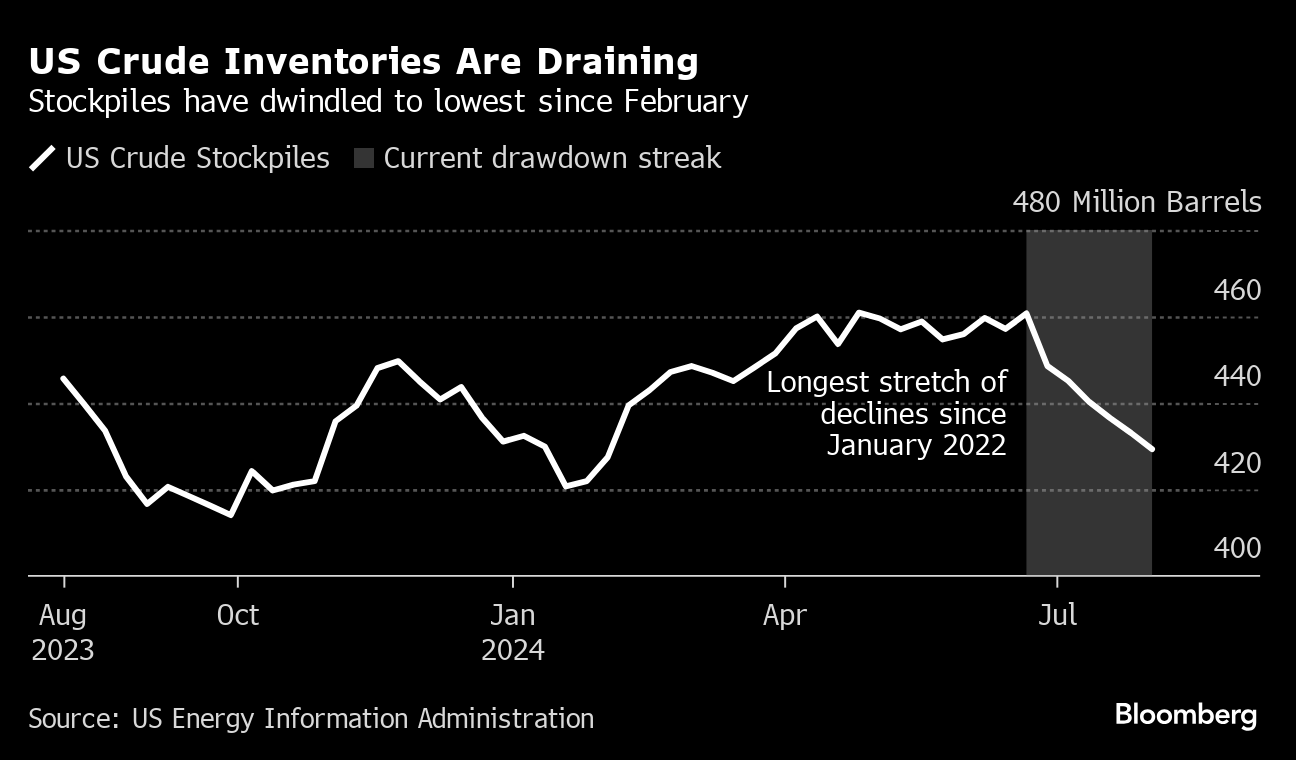
Crude Stockpiles
The slide in US benchmark crude prices in recent weeks is masking a physical market that's showing signs of steadily tightening up. While West Texas Intermediate futures have fallen about 5% since June 21, US crude stockpiles have shrunk by 6.8% in that period. The premium for barrels that are immediately available over later-dated ones is also up in that timeframe and jumped sharply last week, typically an indication of demand outpacing supply. It remains to be seen whether these physical market signals will overtake concerns about the US and Chinese economies and shake futures out of their recent doldrums.
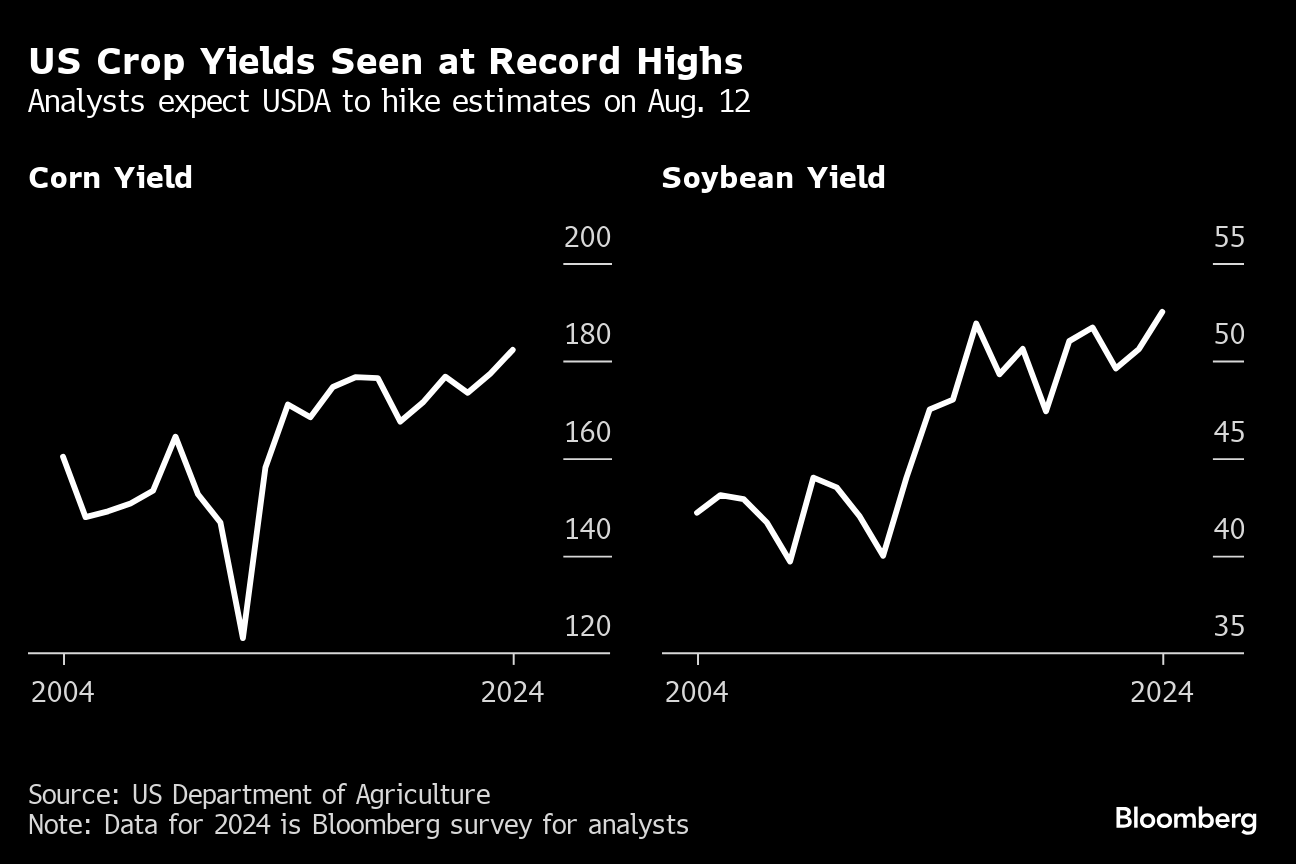
Crop Expansion
The US Department of Agriculture will publish its monthly supply and demand report on Aug. 12. Traders, on average, expect the agency to hike its already record-high estimates for yields of America's two most widely grown crops: corn and soybeans. There's still a potential for planted acres to come in lower than expected after heavy spring rains flooded some fields. A smaller area would partially offset gains in production estimates that were linked to big yields.
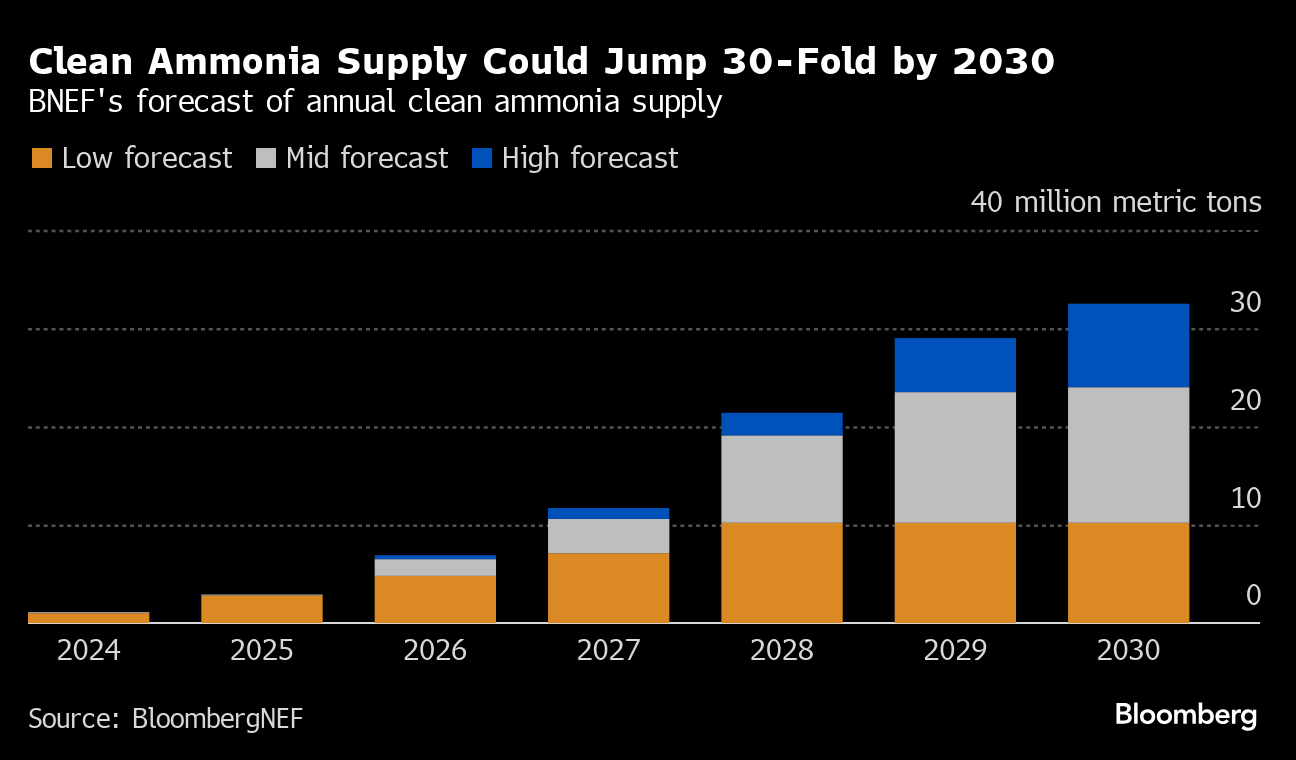
Clean Ammonia
Clean ammonia production could grow as much as 30-fold this decade, making up as much as 13% of global ammonia supply by 2030, according to new research from BloombergNEF. The US is forecast to lead the way in output, with China and the Middle East also contributing to the gains. Quotas, import subsidies, US tax credits and rising Chinese demand are all encouraging the clean ammonia buildout, according to BNEF.
More stories like this are available on bloomberg.com
©2024 Bloomberg L.P.
Essential Business Intelligence, Continuous LIVE TV, Sharp Market Insights, Practical Personal Finance Advice and Latest Stories — On NDTV Profit.


