Even as the Indian economy has grown over the last two decades, the growth has been more unequal in the country than in most other parts of the world, showed data included in the United Nations' Human Development Report 2019. The latest edition of the report focused on ‘Inequalities In Human Development 2019'.
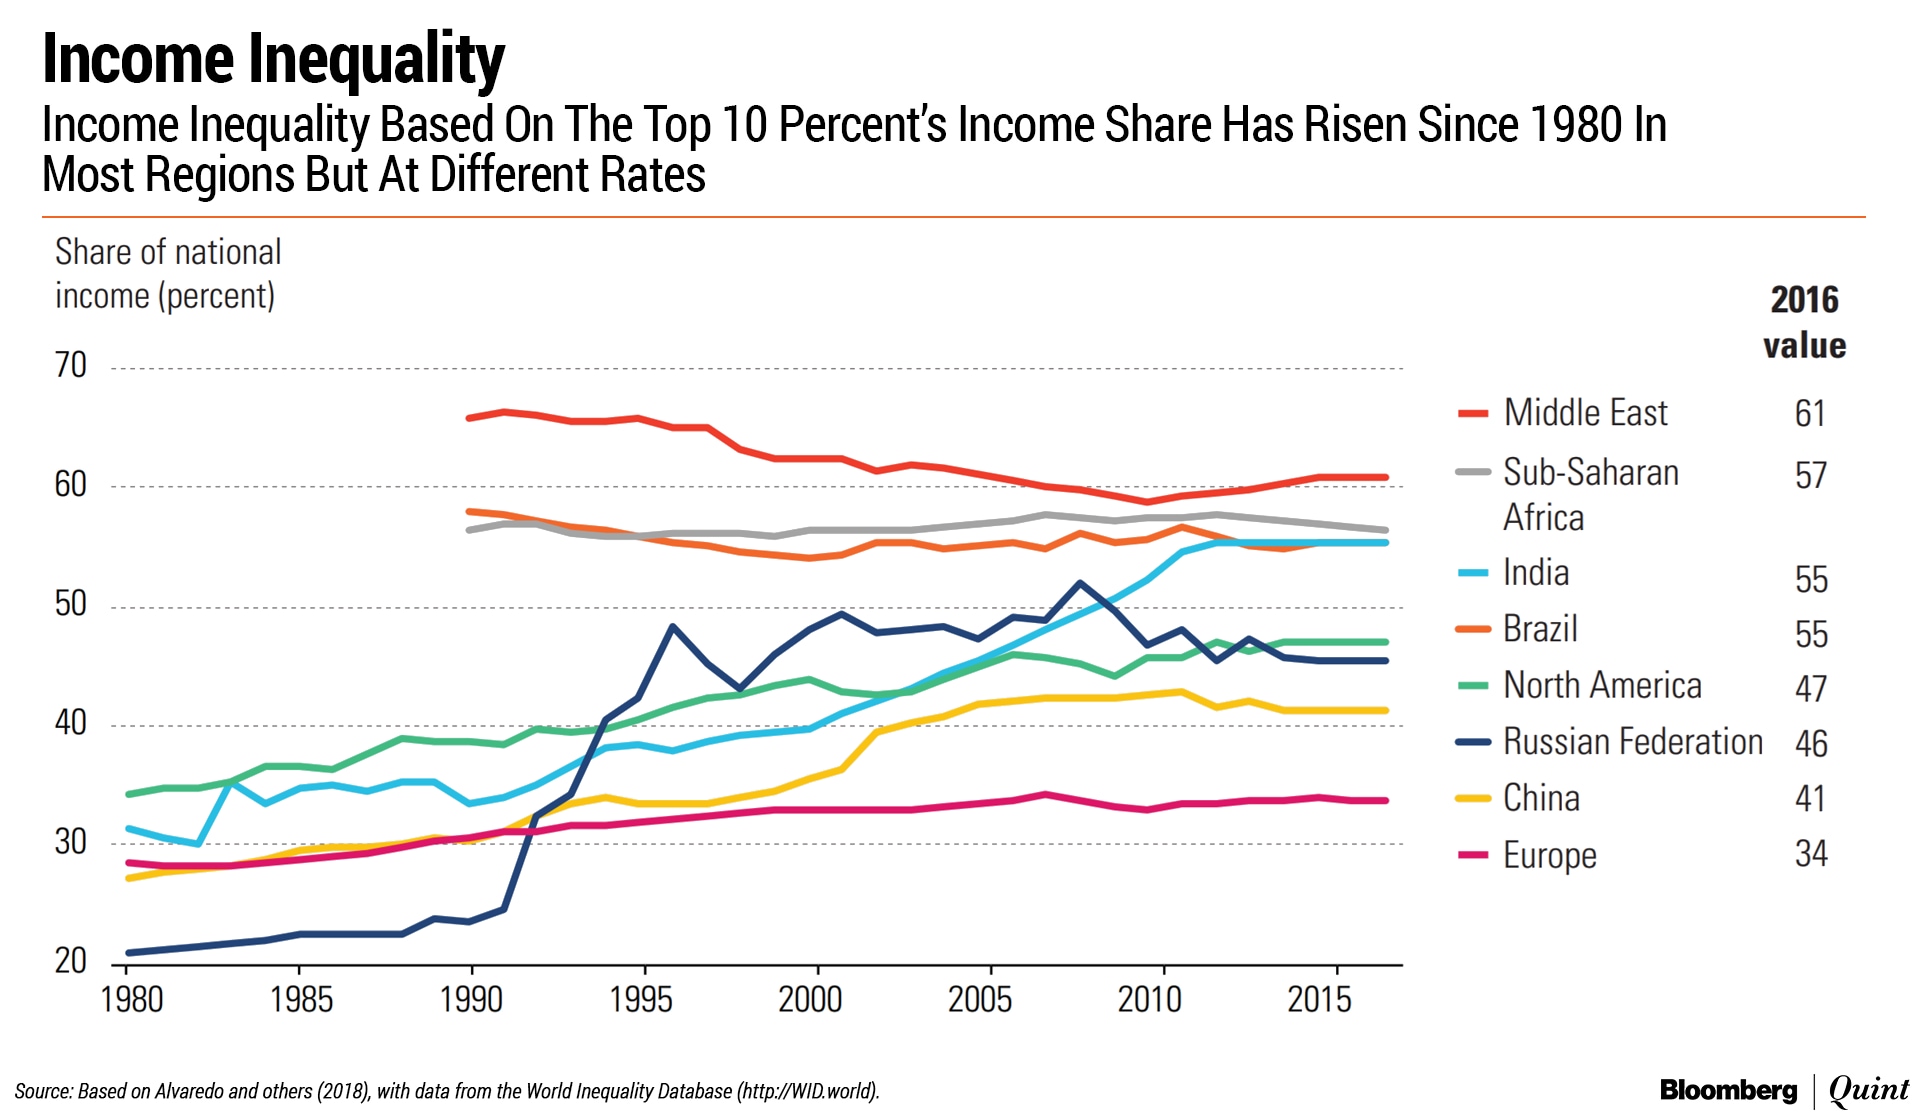
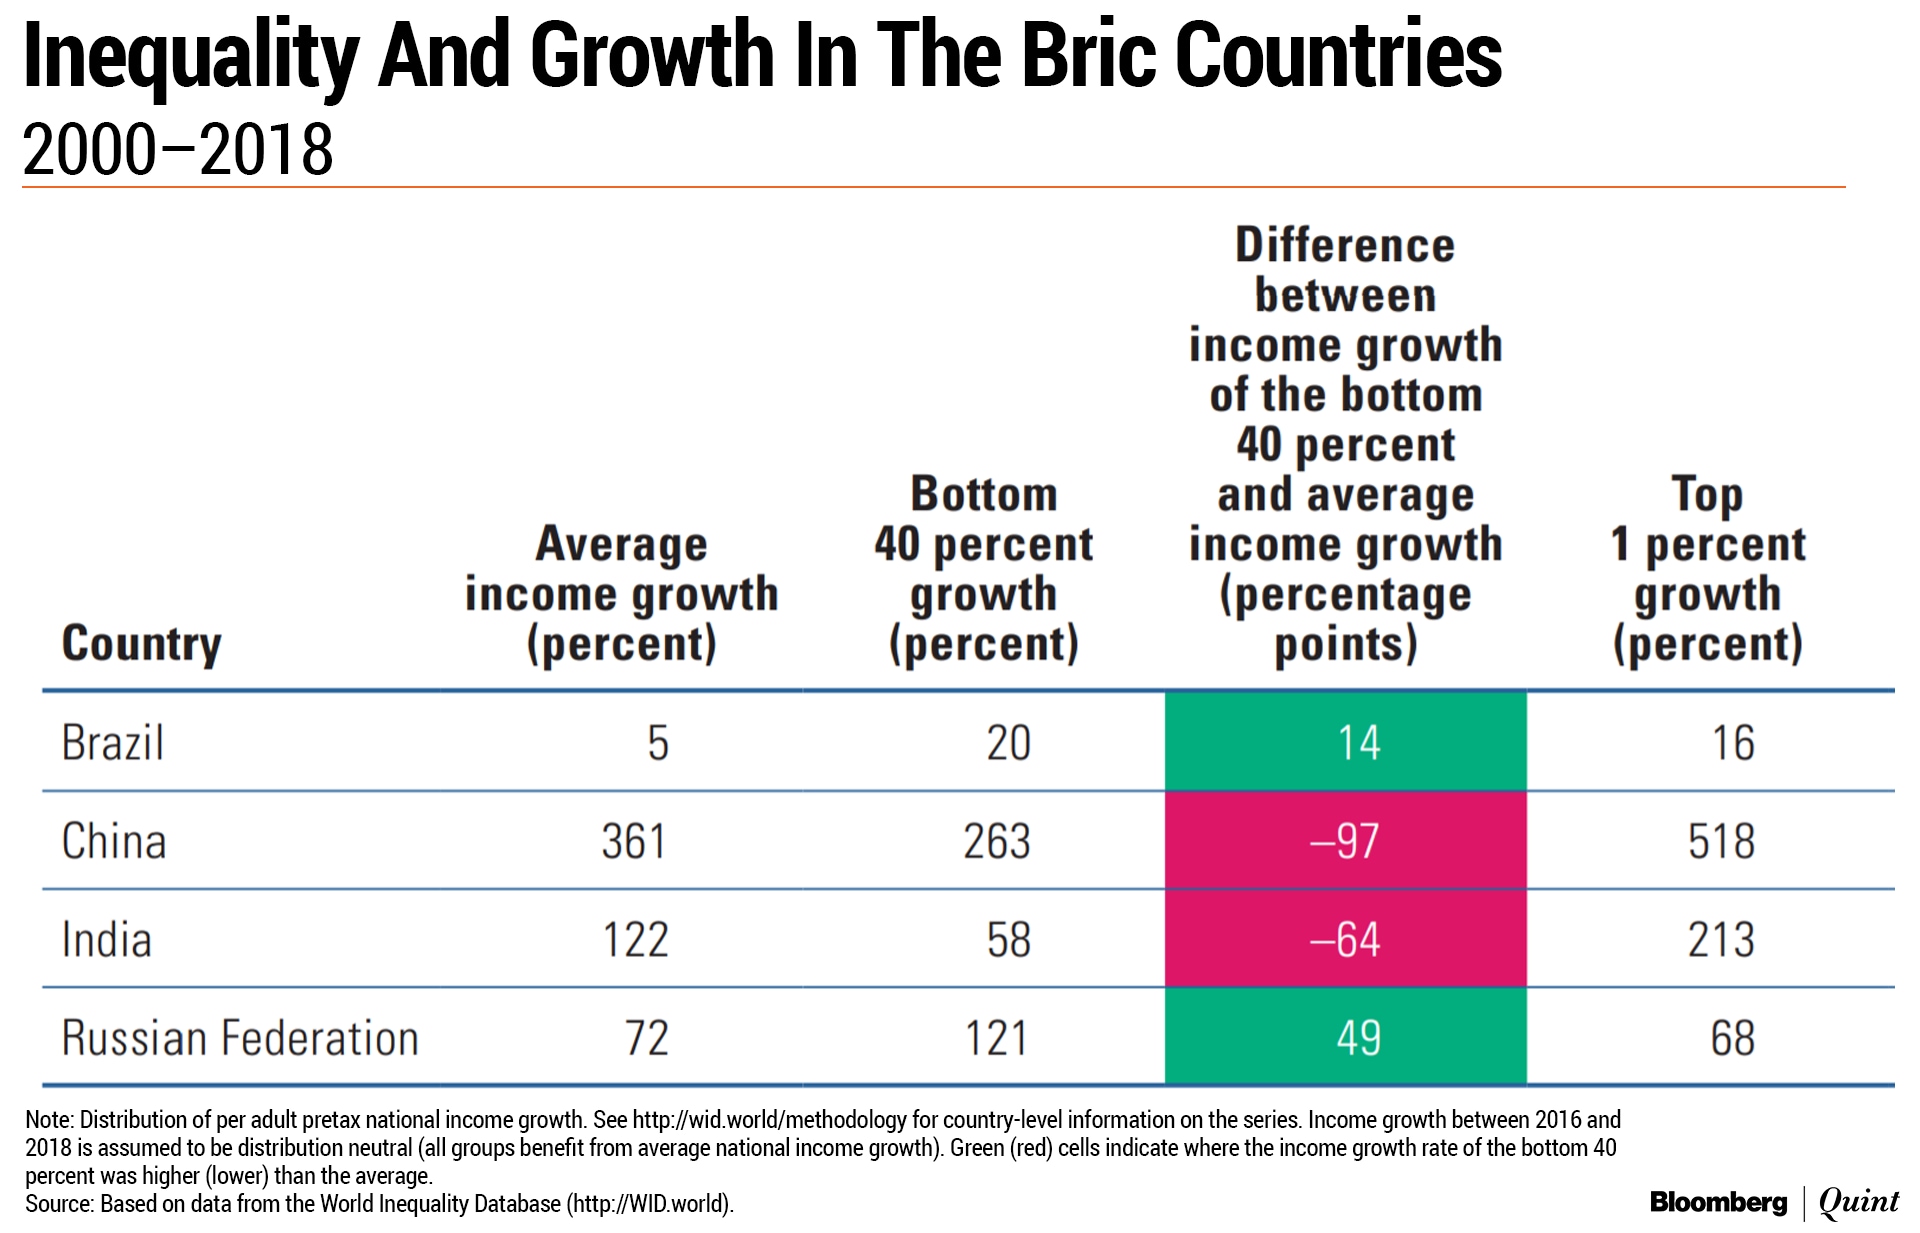
Income inequality based on the top 10 percent's income share has risen since 1980 in most regions but at different rates, the report said. The rise was extreme in the Russian Federation, which has become one of the most unequal countries in terms of income distribution in just five years.
The rise was also pronounced in India and the U.S., though not as sharp as in the Russian Federation. In China, after a sharp rise, inequality stabilised in the mid-2000s, the report said.
For India, inequality worsened the most between 2000 and 2007. During this period, income growth for the top 1 percent of earners in the country grew 213 percent, while the average growth was 122 percent and income growth for the bottom 40 percent of income earners was 58 percent.
This divergence narrowed a bit between 2007 and 2018. During this period, income growth of the top 1 percent fell to 78 percent and average income growth declined to 68 percent. In contrast, income growth for the bottom 40 percent rose 41 percent.
Estimates based on administrative tax data showed that the top 1 percent of earners may have an income share close to 20 percent. Households, however, reported an income share of around 10 percent, suggesting that household survey data starkly underestimated incomes at the top of the distribution, the report said.
The top 10 percent received an estimated 55 percent of income in India.
Also Read: India Moves To 129 From 130 In Human Development Index
Horizontal Inequality In India
The report also pointed to the ‘horizontal inequality' that continues to exist in India.
The study noted that those belonging to Scheduled Castes, Scheduled Tribes and Other Backward Classes underperformed the rest of the society across human development indicators, including education and access to digital technologies.
For instance, the percentage of population with 5 or 12 years of education across Scheduled Tribes, Scheduled Caste and Other Backward Classes remained below other sections of society.
Similarly, the proportion of those who have access to telephones and computers remained lower for these three sectors, though mobile phone penetration was high across all segments of society.
Since 2005-06, however, there has been a reduction in inequalities in basic areas of human development.
“For example, there is a convergence of education attainment, with historically marginalised groups catching up with the rest of the population in the proportion of people with five or more years of education. Similarly, there is convergence in access to and uptake of mobile phones,” the report said.
It said there had been an increase in inequalities in enhanced areas of human development, such as access to computers and to 12 or more years of education. “Groups that were more advantaged in 2005-06 have made the most gains, and marginalised groups are moving forward but in comparative terms are lagging further behind, despite progress.”
No Trickle Down?
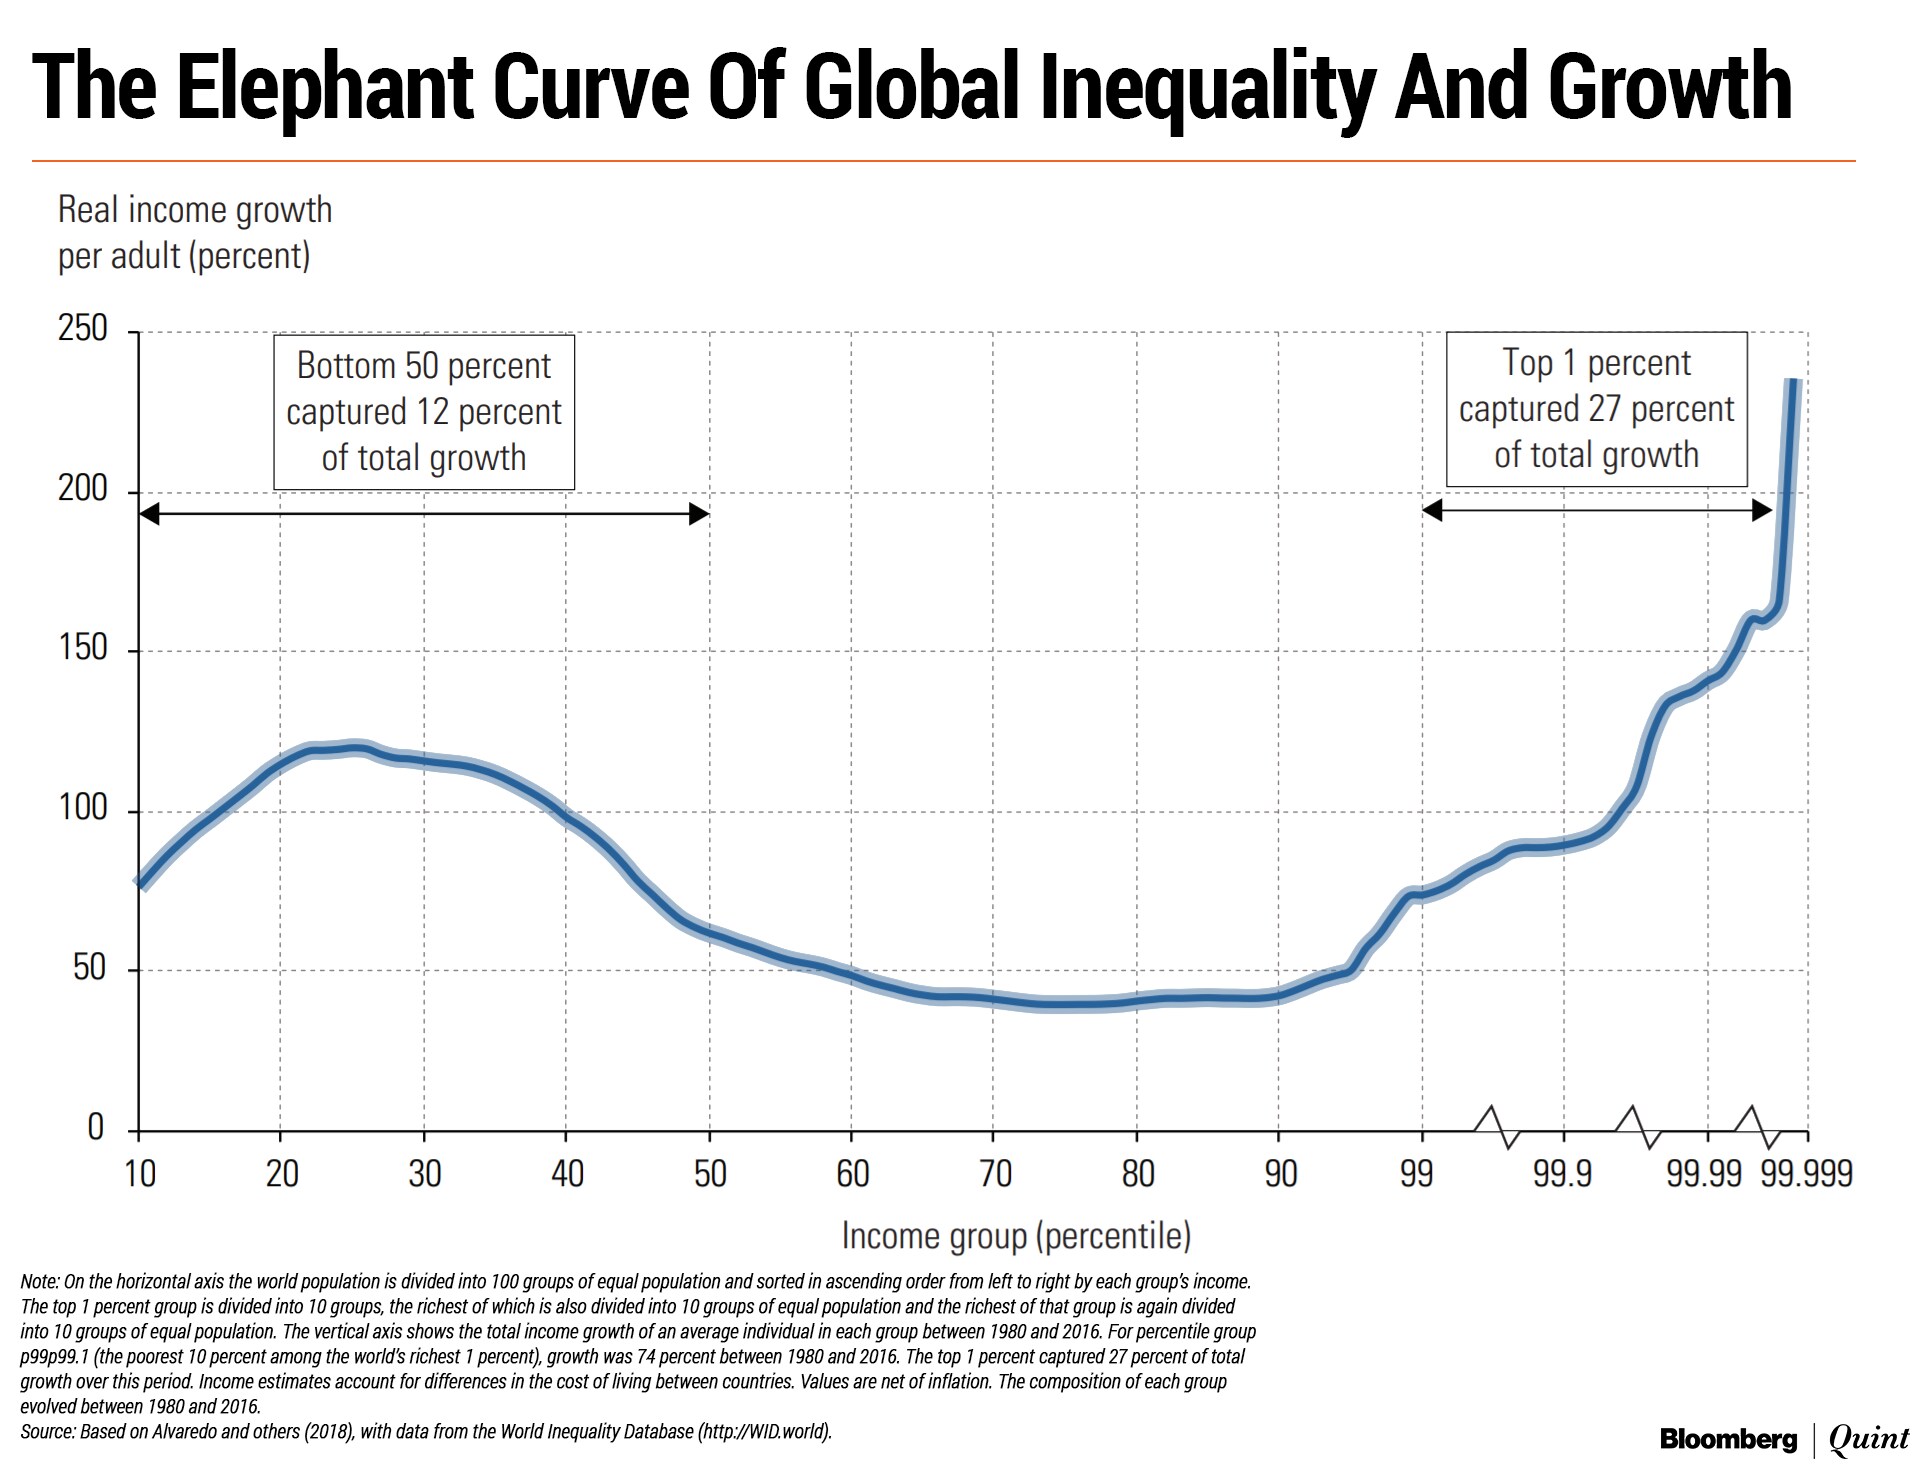
Across the world, the report said the economic elite, who make up the global top 1 percent of earners, made huge gains over 1980-2016.
The top 1 percent alone received 27 percent of income growth over 1980-2016, compared with the 12 percent received by the bottom 50 percent. “A huge share of global growth thus benefited the top of the global income distribution,” the report said, adding this was particularly pronounced in countries like China and India.
Was such a concentration of global growth in the hands of a fraction of the population necessary to trigger growth among bottom income groups?
Country and regional case studies provide very little empirical support to the trickle-down hypothesis over recent decades, the report said. “Higher income growth at the top of the distribution are not correlated with higher growth at the bottom.”
Essential Business Intelligence, Continuous LIVE TV, Sharp Market Insights, Practical Personal Finance Advice and Latest Stories — On NDTV Profit.


