Indian mid and small caps have had a tremendous run in the past 18 months. Both the Nifty Midcap 150 Index and the Nifty Smallcap 250 Index are up 85% since Jan. 1, 2023. However, in these sectors, froth and euphoria are beginning to appear. Let's look at some charts to better understand this.
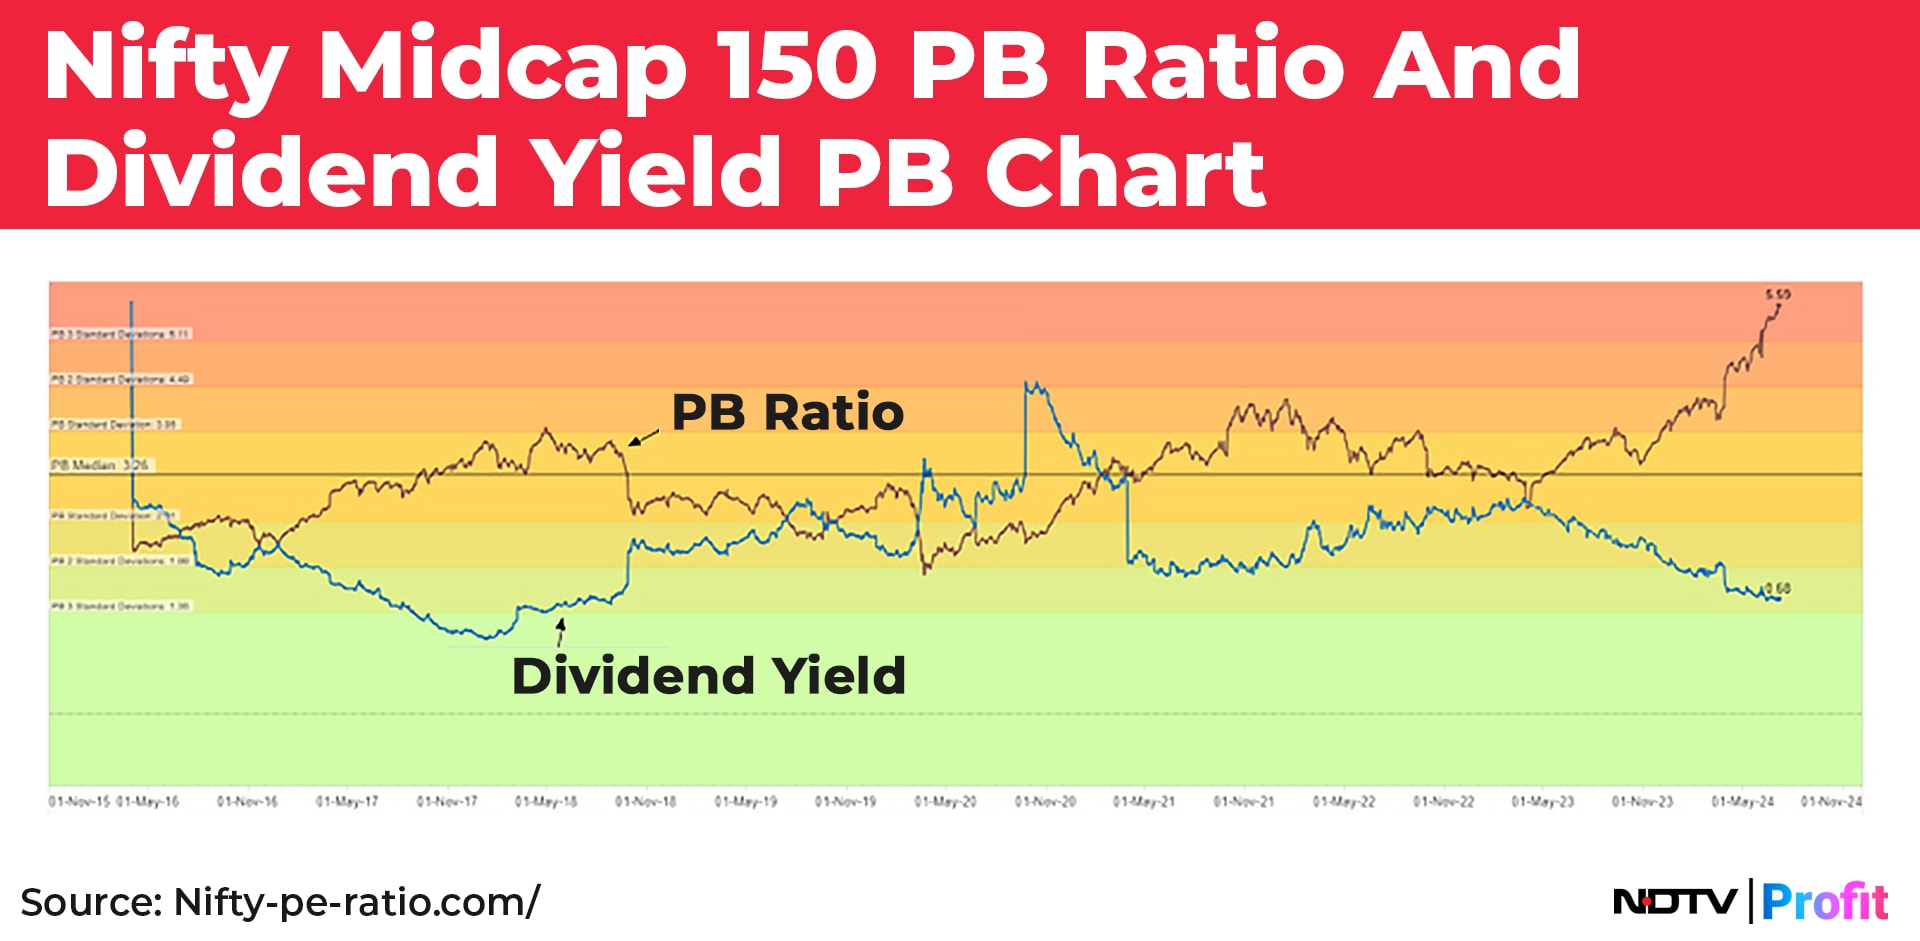
The Midcap 150 Index is trading at a price-to-book ratio of 5.59, which is 3 standard deviations above its past nine-year mean. This shows an extreme overvaluation of midcaps.
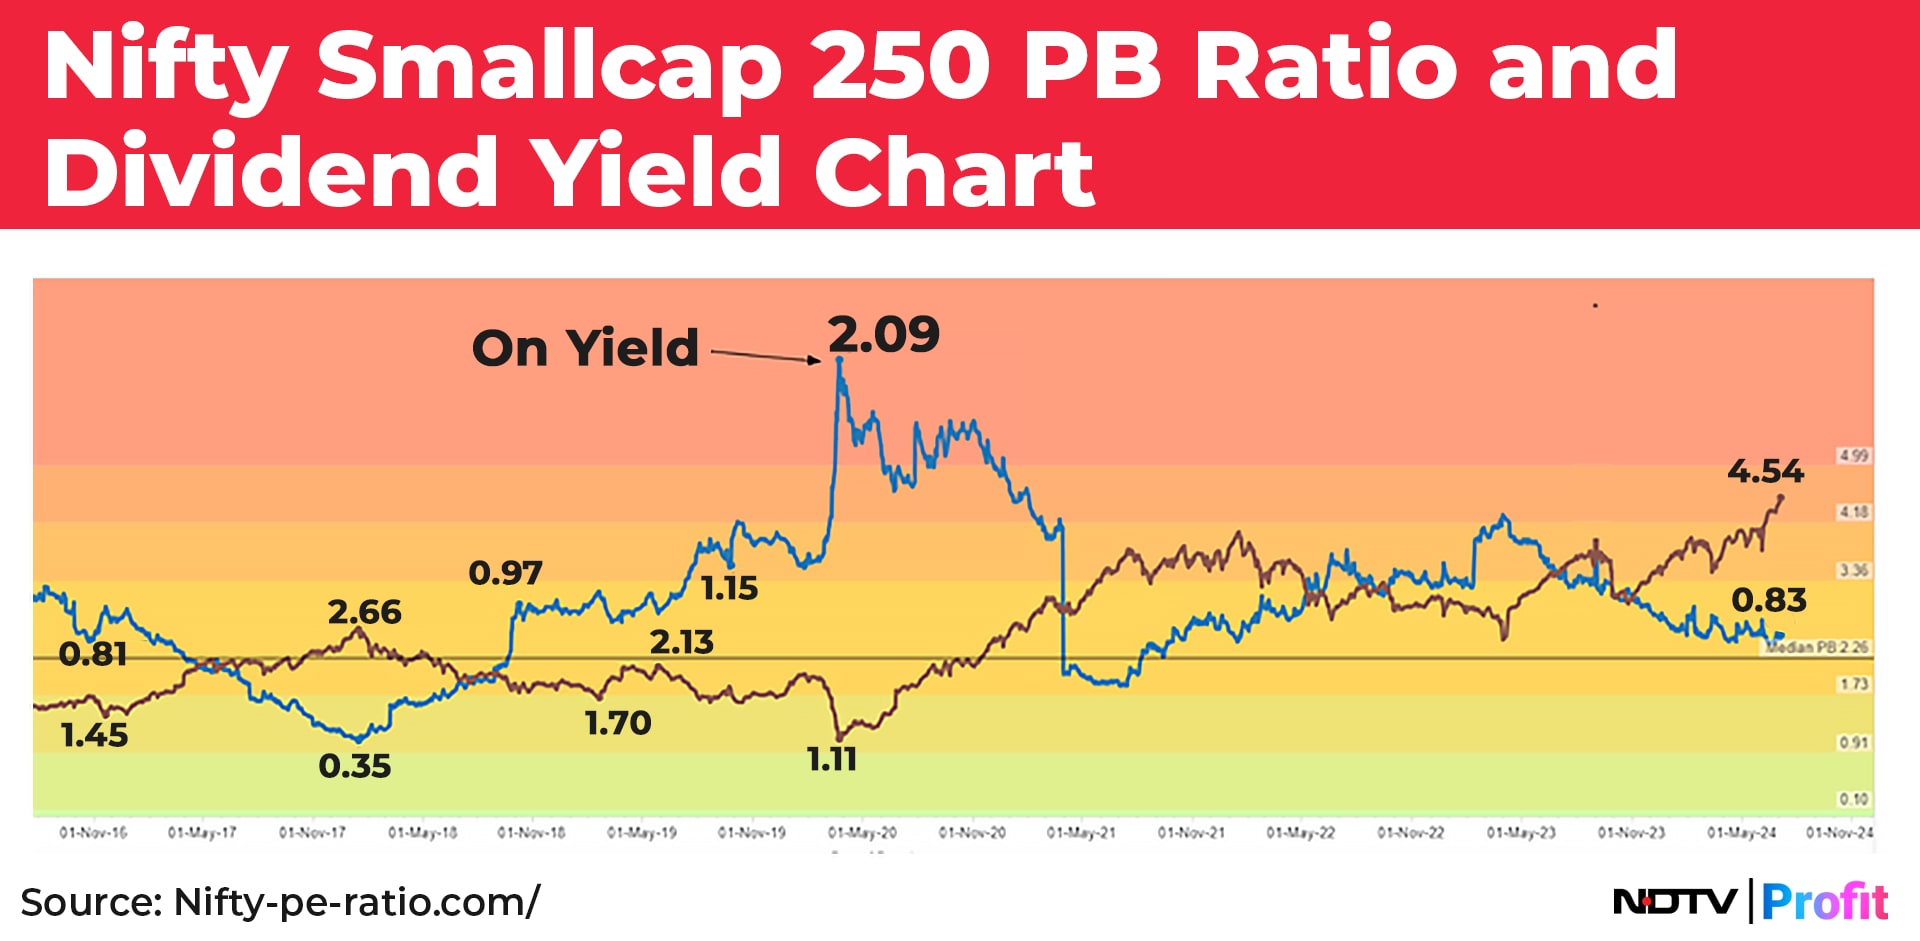
Similarly, the Smallcap 250 Index is trading at a price-to-book ratio of 4.54—shown by the Brown line in the below graph—which is again nearing 3 standard deviations above its past nine-year mean. Similar to the Midcap Index, this too shows extreme overvaluation for small caps as well.
The relative overvaluation of mid and small caps is also evident when comparing the price-to-earning ratios of the Midcap 150, the Smallcap 250, and the Nifty 50.
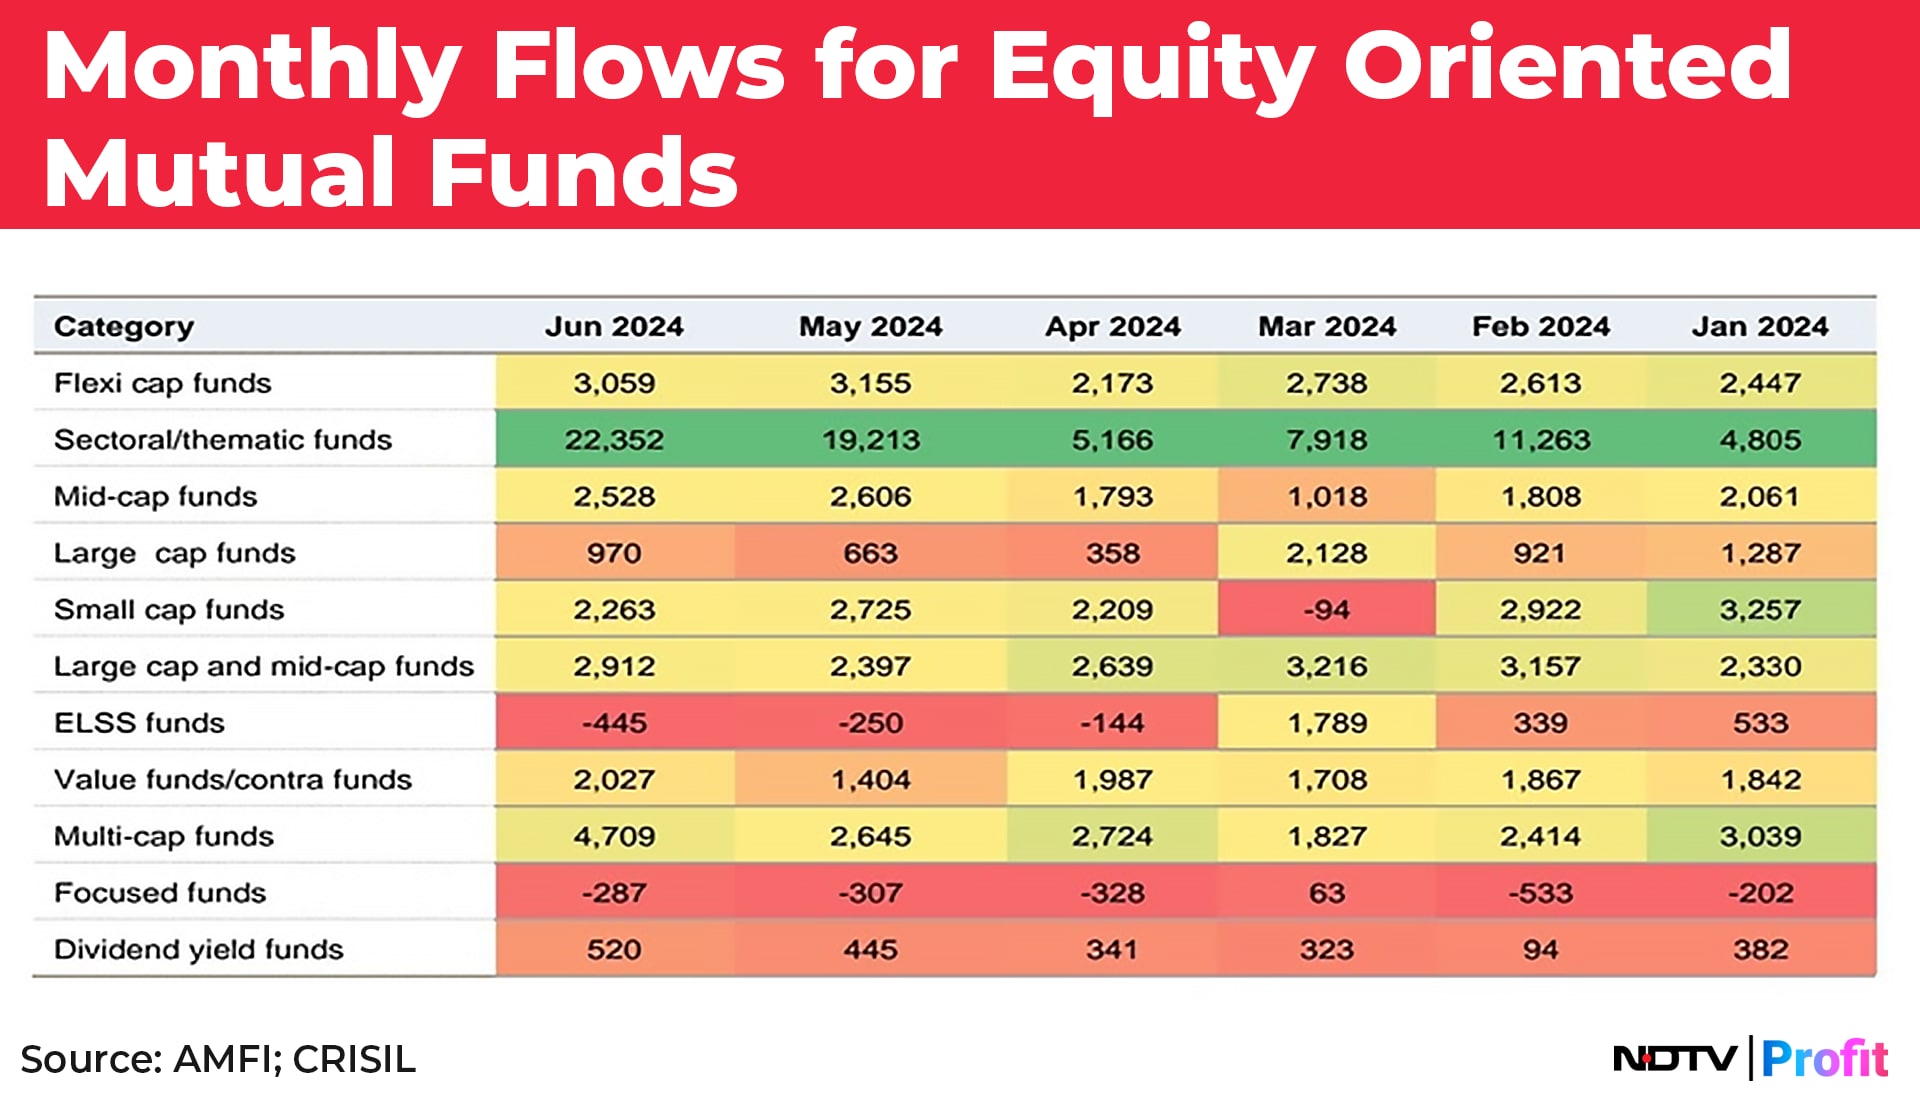
This overvaluation and euphoria in mid caps and small caps is also evident from the large inflows mid-caps funds and small-cap funds have been getting in the past six months. Retail investors have been piling into these funds at a time when, ideally, they should be reducing their exposure to these sectors.
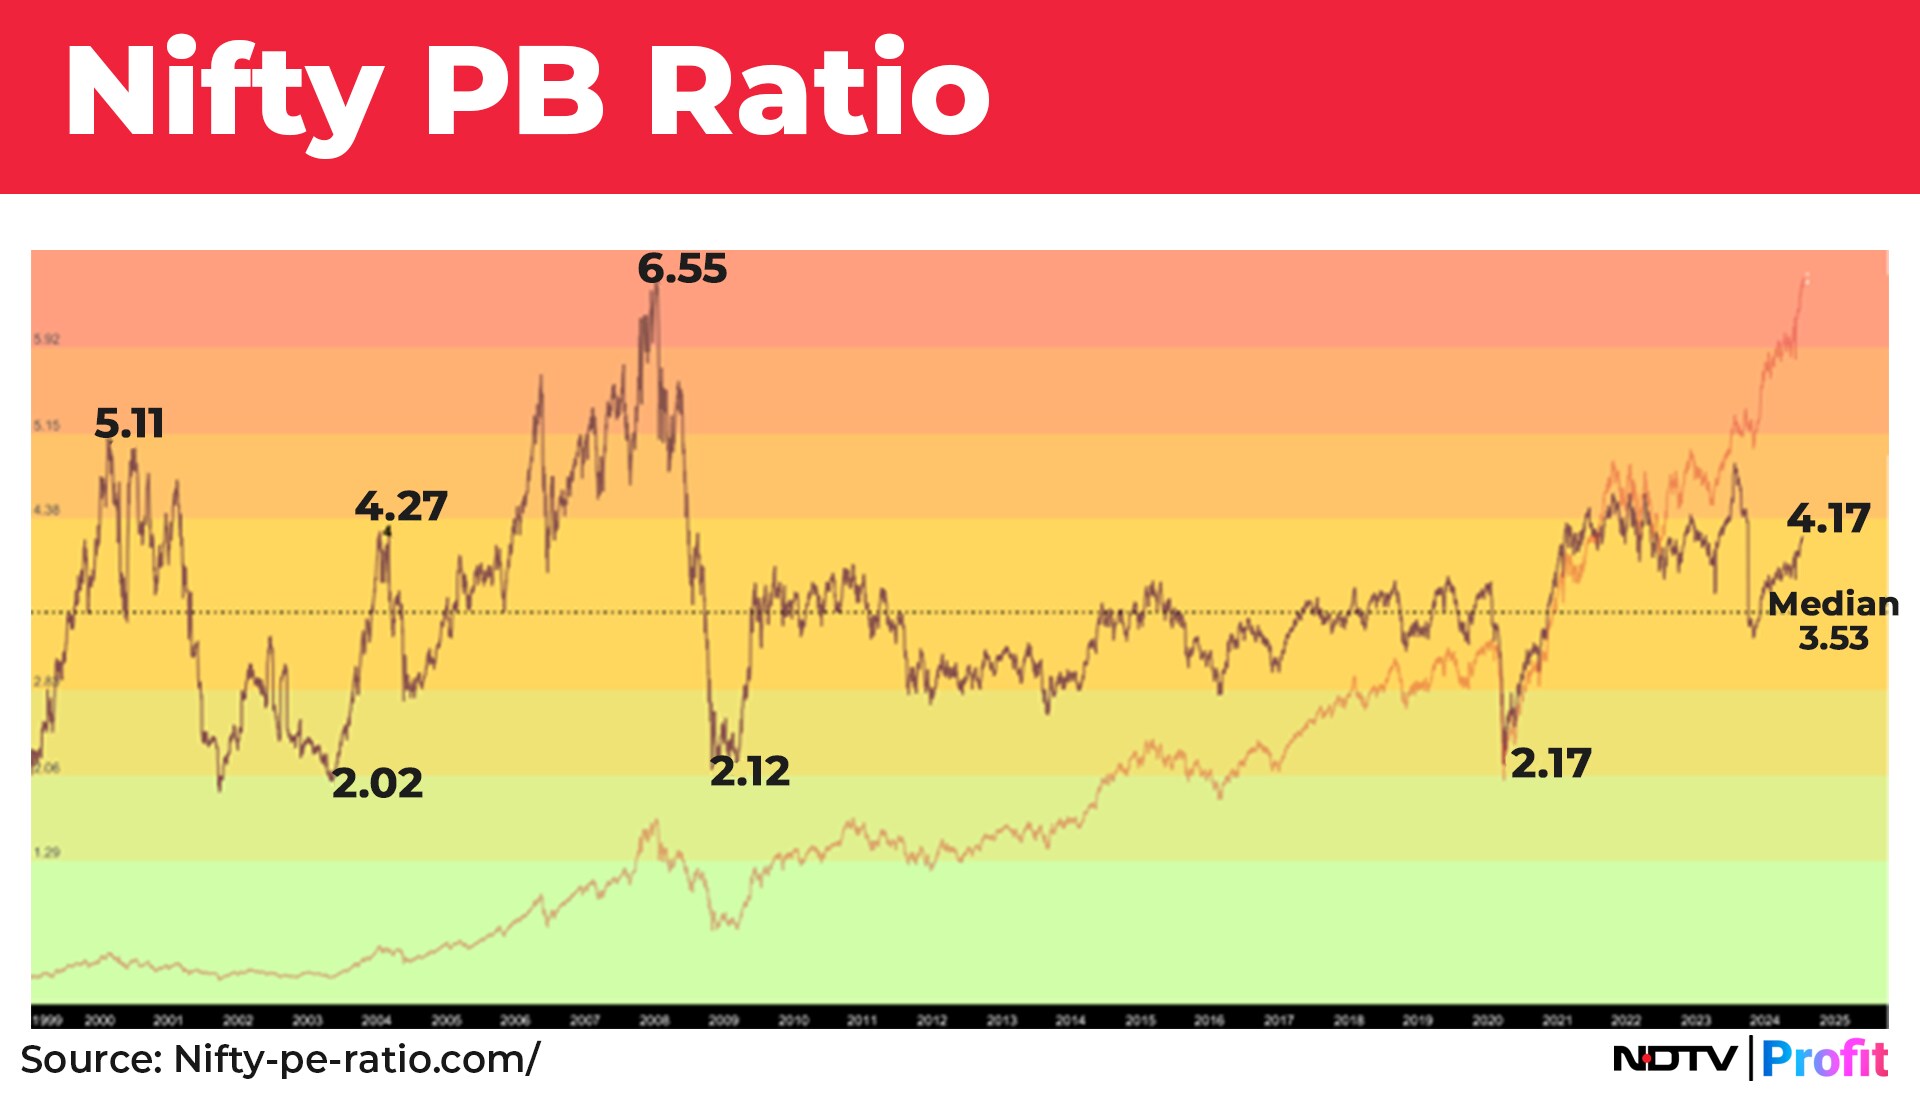
A similar price-to-book graph for the benchmark Nifty 50 shows a relatively overvalued picture of the large-cap sector. The current price-to-book is 4.17, which is within 1 standard deviation of the mean valuation over the past 25 years. This shows that large caps are better placed now, and their valuation is relatively better than small caps and midcaps, which look highly overvalued.
In terms of technical analysis, a ratio chart comparing the Nifty Smallcap 100 Index to the Nifty on a weekly timeframe is approaching the resistance of a reverse channel pattern, suggesting that the current outperformance of small caps may pause, as large caps currently offer a higher risk reward.
.png)
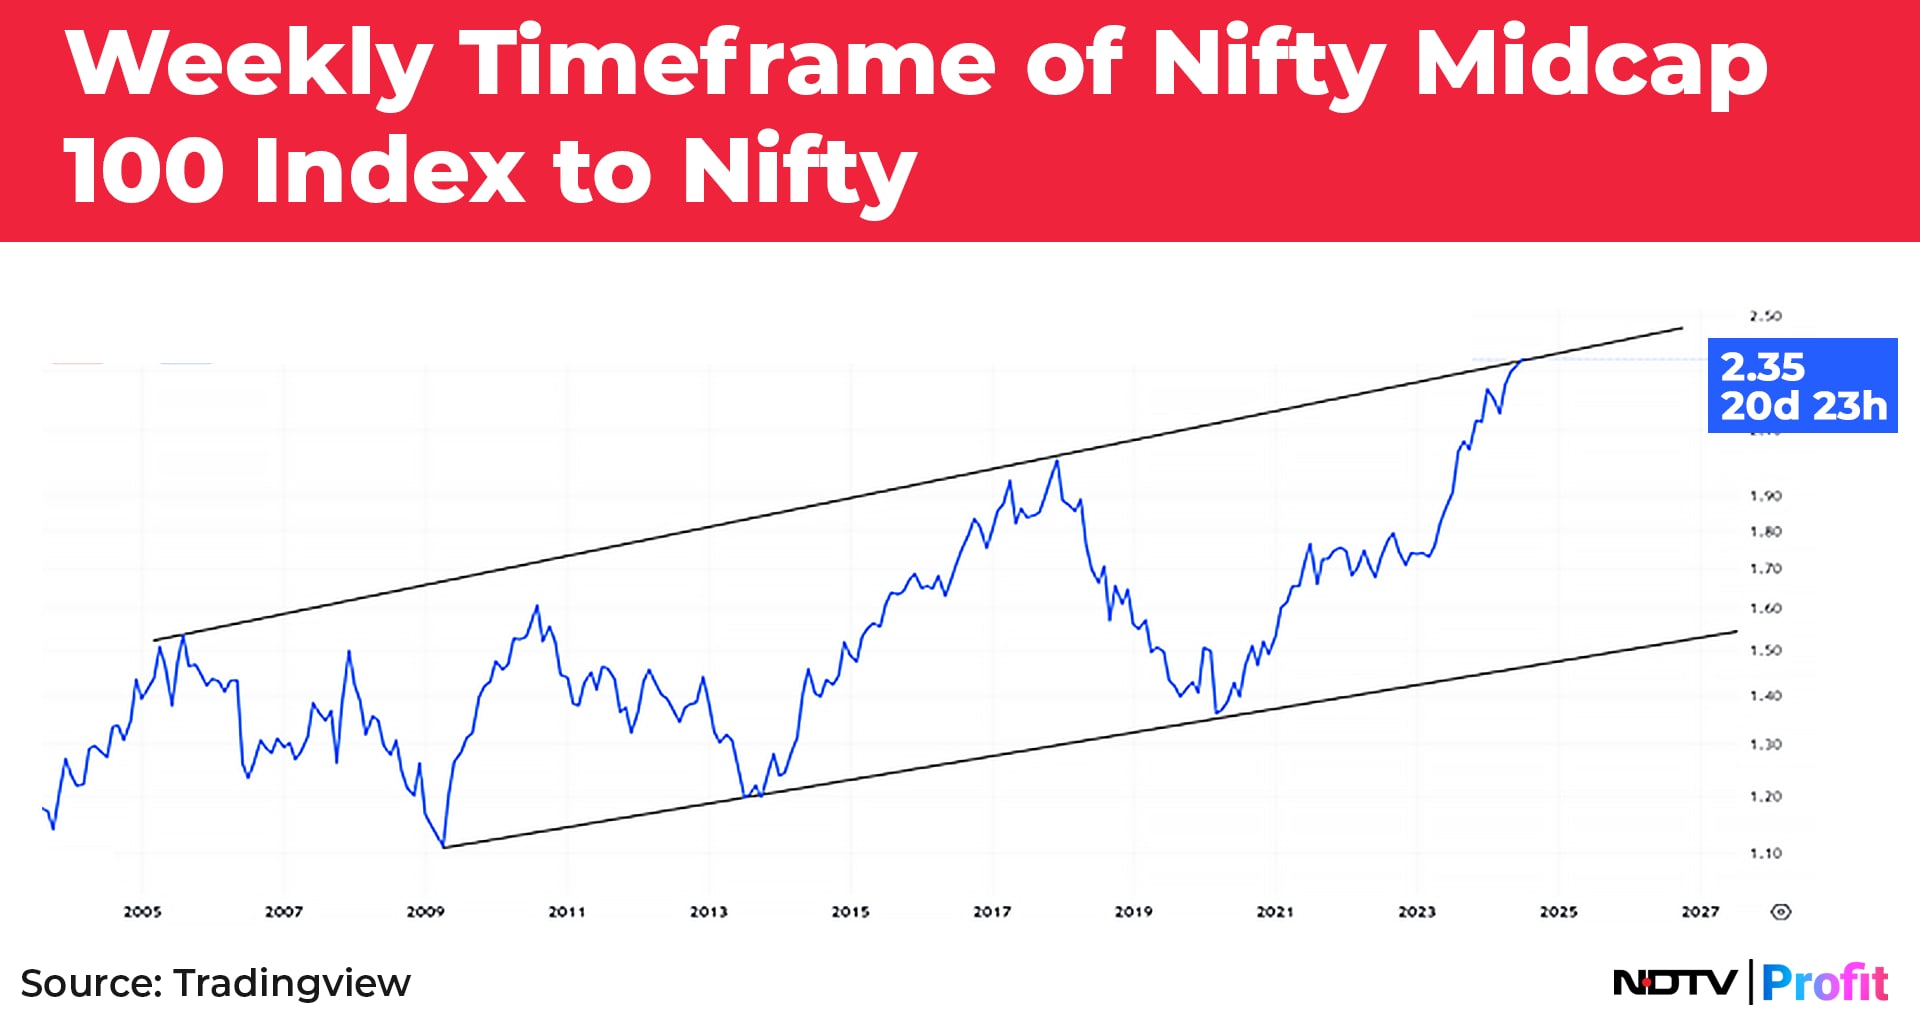
A similar pattern can also be seen on a ratio chart for the weekly timeframe of the Nifty Midcap 100 Index to Nifty. It is hitting the resistance of a channel pattern, implying that the outperformance of mid caps too should take a breather while large caps should outperform going forward.
Gaurav Chopra is an investor and algo trader.
Disclaimer: The views expressed here are those of the author and do not necessarily represent the views of NDTV Profit or its editorial team.
Essential Business Intelligence, Continuous LIVE TV, Sharp Market Insights, Practical Personal Finance Advice and Latest Stories — On NDTV Profit.