In the week before the union budget, Indian equities marked a six-day losing streak after hitting an all-time high on Jan. 21.
During this period, the S&P BSE Sensex and NSE Nifty 50 have fallen by about 3,899 points and 1,119 points from their all-time intra-day highs of 50,184 and 14,753, respectively.
As a result, the Nifty broke its key 50-day moving average level of 13,743, ending below it.
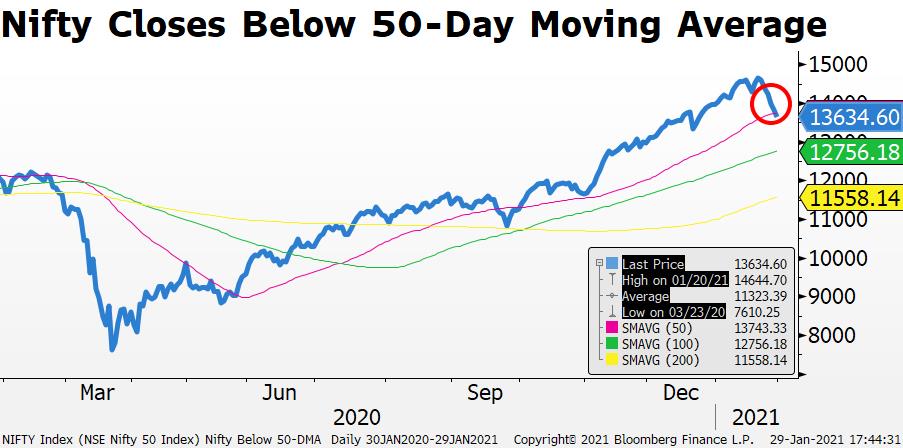
“We were skeptical when the markets were making new highs. The index breaking levels of 14,222 was the first sign of weakness for us,” Sameet Chavan, chief technical and derivatives analyst at Angel Broking, told BloombergQuint over phone. “The Nifty has now closed below the five-week exponential moving average, which tells us that a move towards 13,200-13,000 cannot be ruled out.”
Indian equities nearly doubled from their multi-year lows in March 2020 as economic recovery following the strictest lockdown due to Covid-19 was faster than expected and foreign investors continued to plough money into the country's stock markets.
Chavan said any bounce in the index towards levels of 14,000-14,200 can be an exit opportunity. On the flip side, he said any decline below levels of 13,000 can be a good buying opportunity for long-term investors.
Key Contributors To Downside
The six-day fall since Jan. 21 has seen the Nifty decline over 7% from its record high, with Reliance Industries Ltd. being the major contributor to the downslide in terms of points. The company contributed as many as 160 points out of the 1,100-point fall seen on the index.
The stock has declined 12% over the last five trading sessions which has been the worst five-day drop for the index heavyweight since March last year. As a result, the stock is now trading below its 50, 100 and 200-day moving averages.
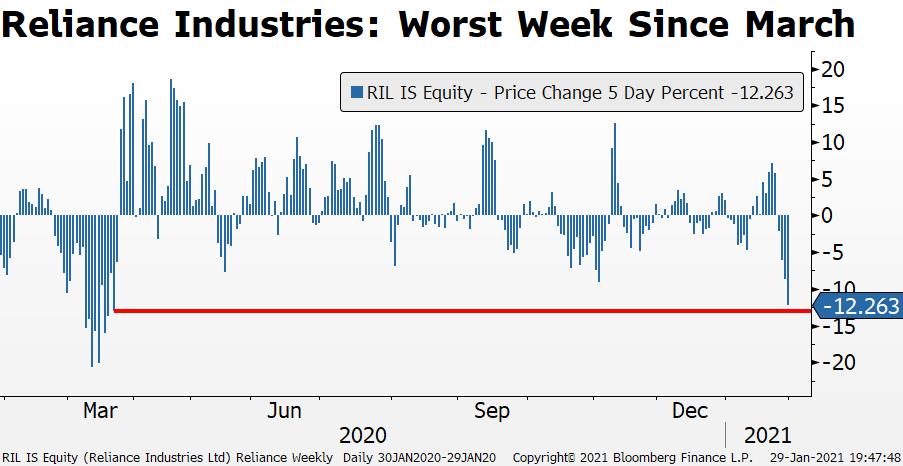
Chavan also said Reliance Industries has one of the weakest charts among the Nifty constituents. “Not only has Reliance broken its 200-day simple moving average, but it's also about to slide below its swing low of Rs 1,800,” he said. “Once it slides below Rs 1,800, the next level to watch would be Rs 1,700-1,680. While it's difficult to say what the view on the stock would be at those levels, one should definitely not short aggressively.”
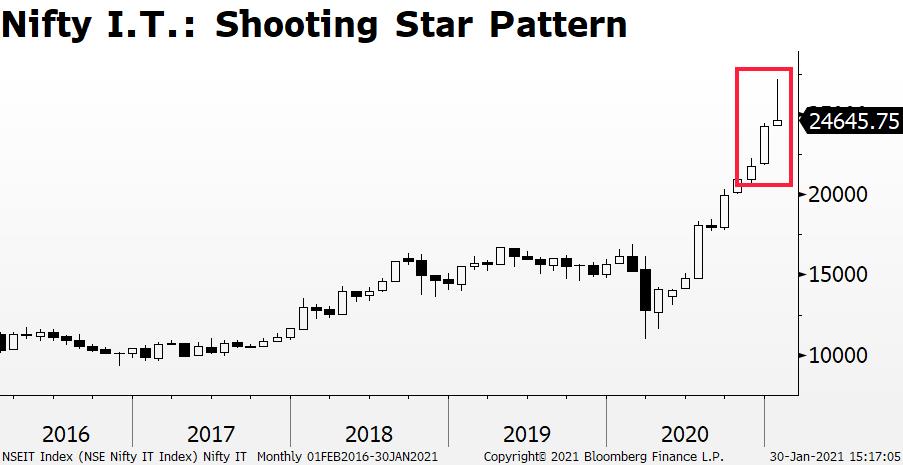
Chavan identified the I.T. sector as another pocket of weakness. The Nifty I.T. index fell 7% during this truncated week—its worst weekly performance in nine months. All but one stock out of the 10-stock index delivered negative returns for the week.
Chavan said the decline in companies like Infosys Ltd. (down 7.5% for the week), Tata Consultancy Services Ltd. (5.8% decline) and HCL Technologies Ltd. (7.3% fall) would extend further.
“The Nifty I.T. on the monthly chart has given a shooting star pattern with today's closing,” he said. “We expect further downside of another 1,500 to 1,600 points going forward.”
Chavan said stocks like Infosys would slide to levels of Rs 1,150-Rs 1,130, HCL Technologies to Rs 850-840 and TCS at Rs 2,900—implying a potential downside of 7-9% from their closing levels on Jan. 29.
Banks To Outperform?
The Nifty Bank index has corrected 2,277 points from its all-time high of 32,842 on Jan. 21. It has, however, outperformed the Nifty 50 on Jan. 28 and 29, gaining 0.2% and 0.7%, respectively.
While Chavan expects the Nifty 50 to slide to levels of 13,200-13,000, he doesn't expect fall of a similar quantum for banking stocks. “Banking stocks may correct but not the way stocks like Reliance Industries or IT (information technology) stocks have.”
Chavan sees 29,000-28,800 to be a crucial support zone for the banking index going ahead.
More Volatility Ahead?
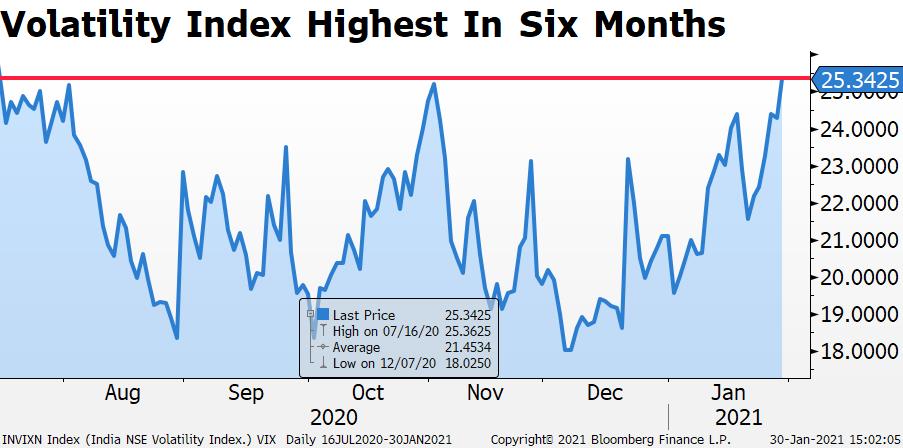
The India Volatility Index is trading at the highest level since July last year, closing at 25.34 on Friday.
Chavan said once the budget concludes, the focus will move back to global indices. “26-27 is a crucial level for the VIX. Over the last 6-7 months it hasn't gone beyond those levels,” he said, adding he expects a spike if it goes beyond 27, although it may not go beyond 30 as of now.
Essential Business Intelligence, Continuous LIVE TV, Sharp Market Insights, Practical Personal Finance Advice and Latest Stories — On NDTV Profit.


