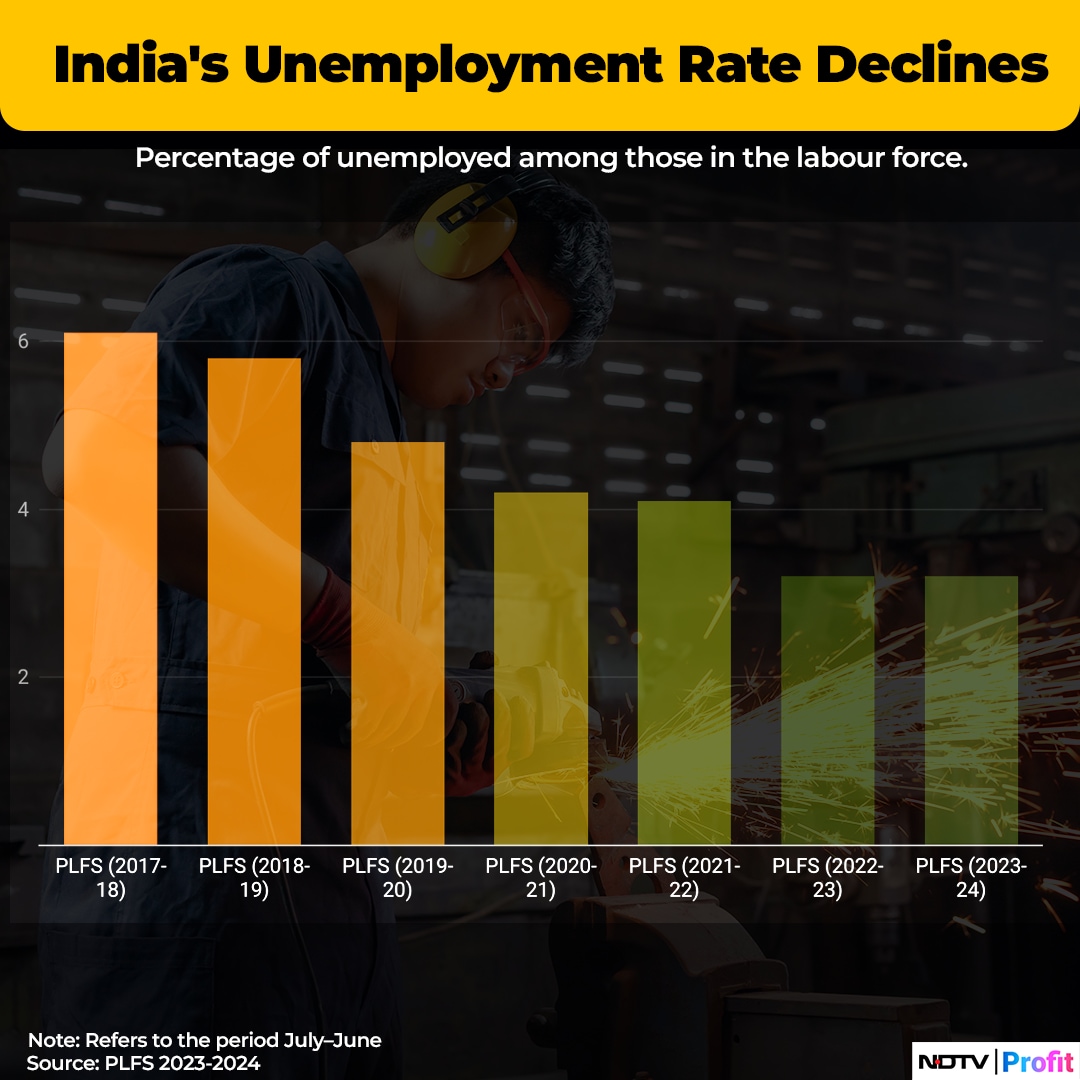
The government this week released the periodic labour force survey for the period July 2023 to June 2024. The report showed unemployment declining in India over the years and rising participation of women in the workforce.
The Indian economy grew by 8.2% in the financial year 2023-24, well above initial estimates, to consolidate its position as the fastest-growing major economy in the world. The GDP has grown above 6% on average in the last 10 years of the Modi government.
The labour survey is published by the Ministry of Statistics and Programme Implementation. The survey has been conducted by the National Sample Survey Office since 2017.
Key Findings Of PLFS 2023-24: In Charts
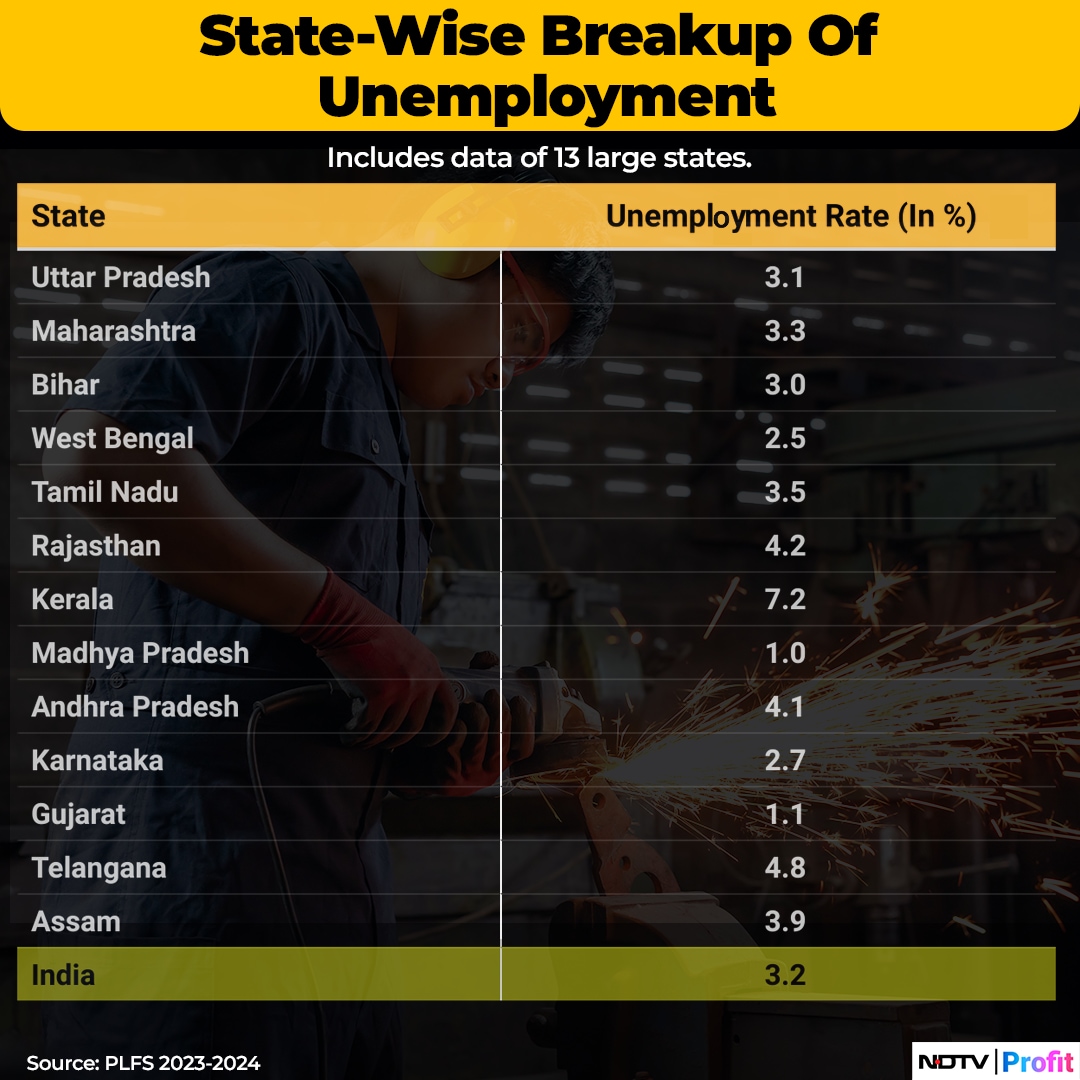
The unemployment rate remains unchanged at 3.2% in 2023–24 for urban and rural areas. Among large states, Kerala reported the highest joblessness at 7.2%, while Madhya Pradesh reported a 1% unemployment rate.
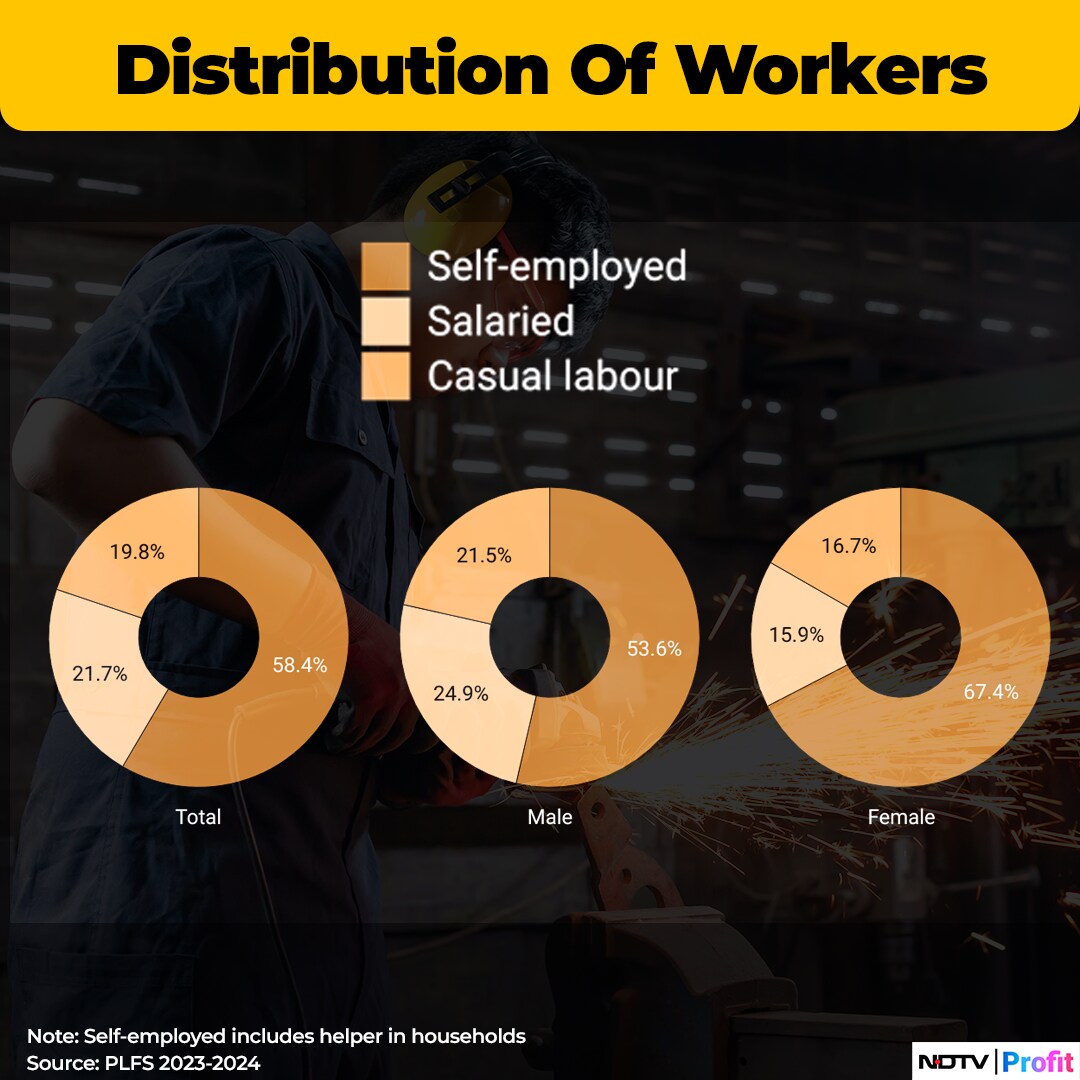
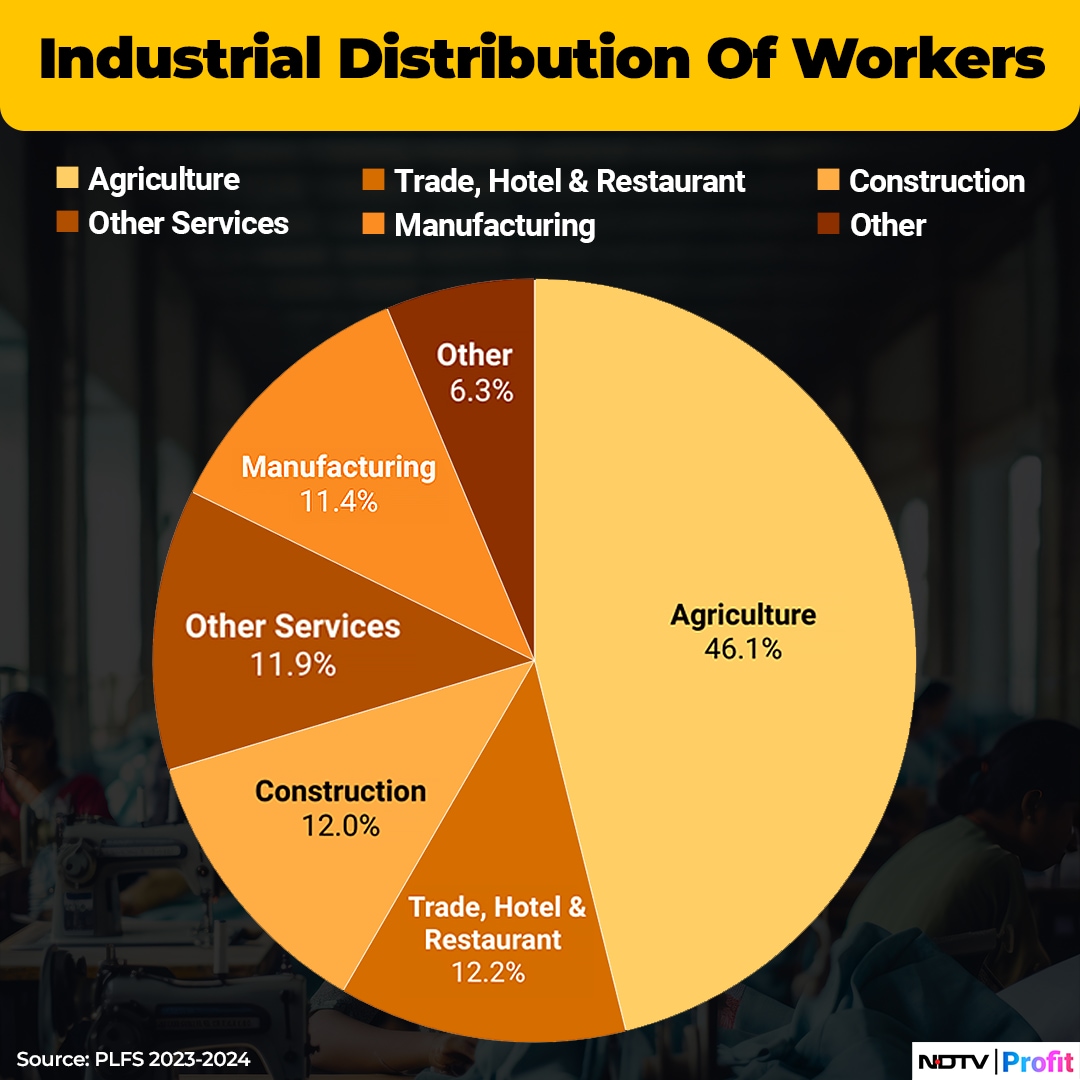
Composition Of Workforce
Notably, the rise in employment can be attributed to the increase in share of self-employed persons, which rose from 57.3% in 2022–23 to 58.4% in 2023–24. Within the category of self-employed, two sub-categories have been made—own account worker and employer and unpaid helper in household enterprises.
In the case of females, they saw a rise in the share of own account workers and employers, while males saw a rise in share as helpers in household enterprises.
The share of workers employed by the agriculture sector rose by 46.1% in 2023–24, compared to 45.8% a year ago. While manufacturing continued to see a steady share of workers at 11.4%, construction saw fewer workers at 12% in 2023–24, compared to 11% a year ago.
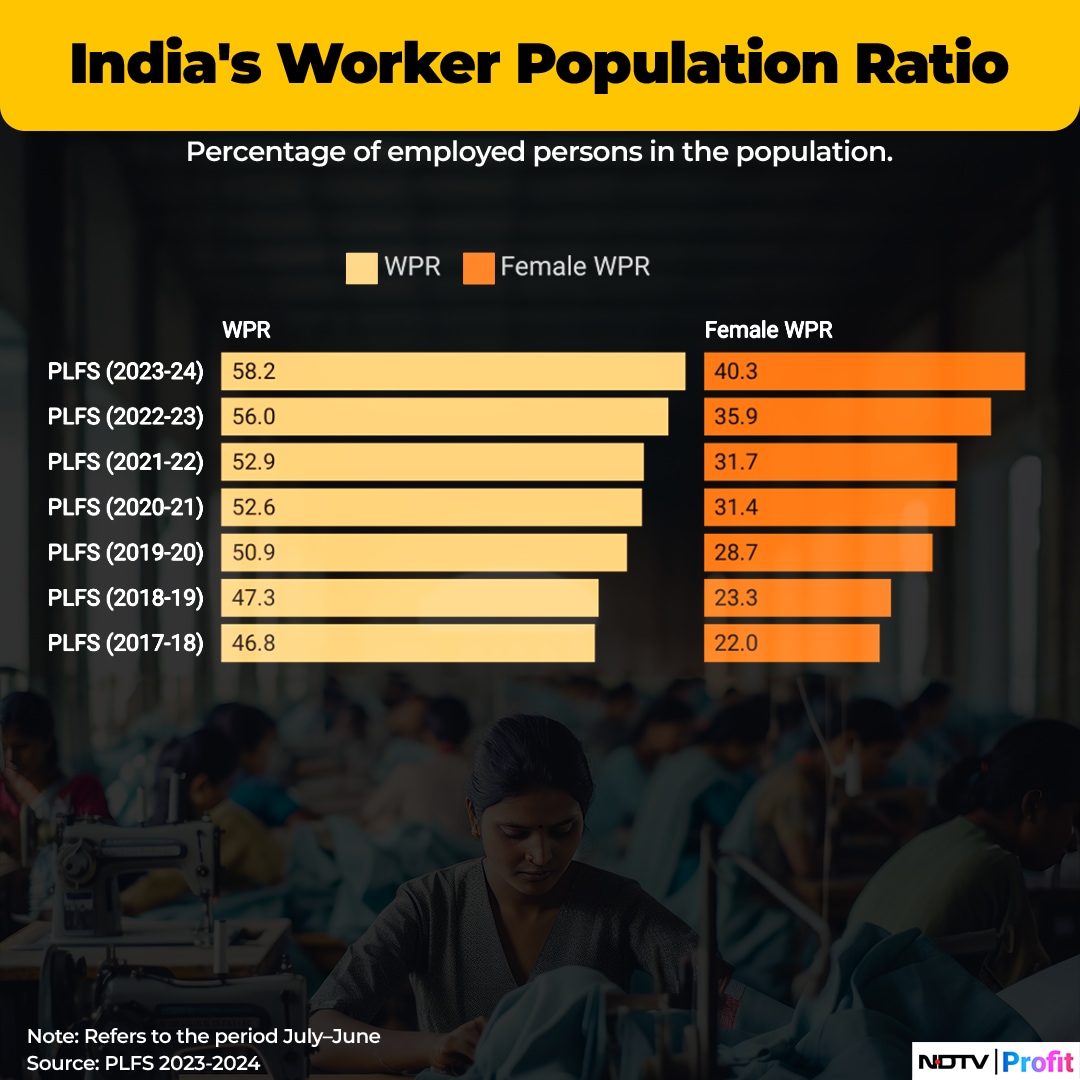
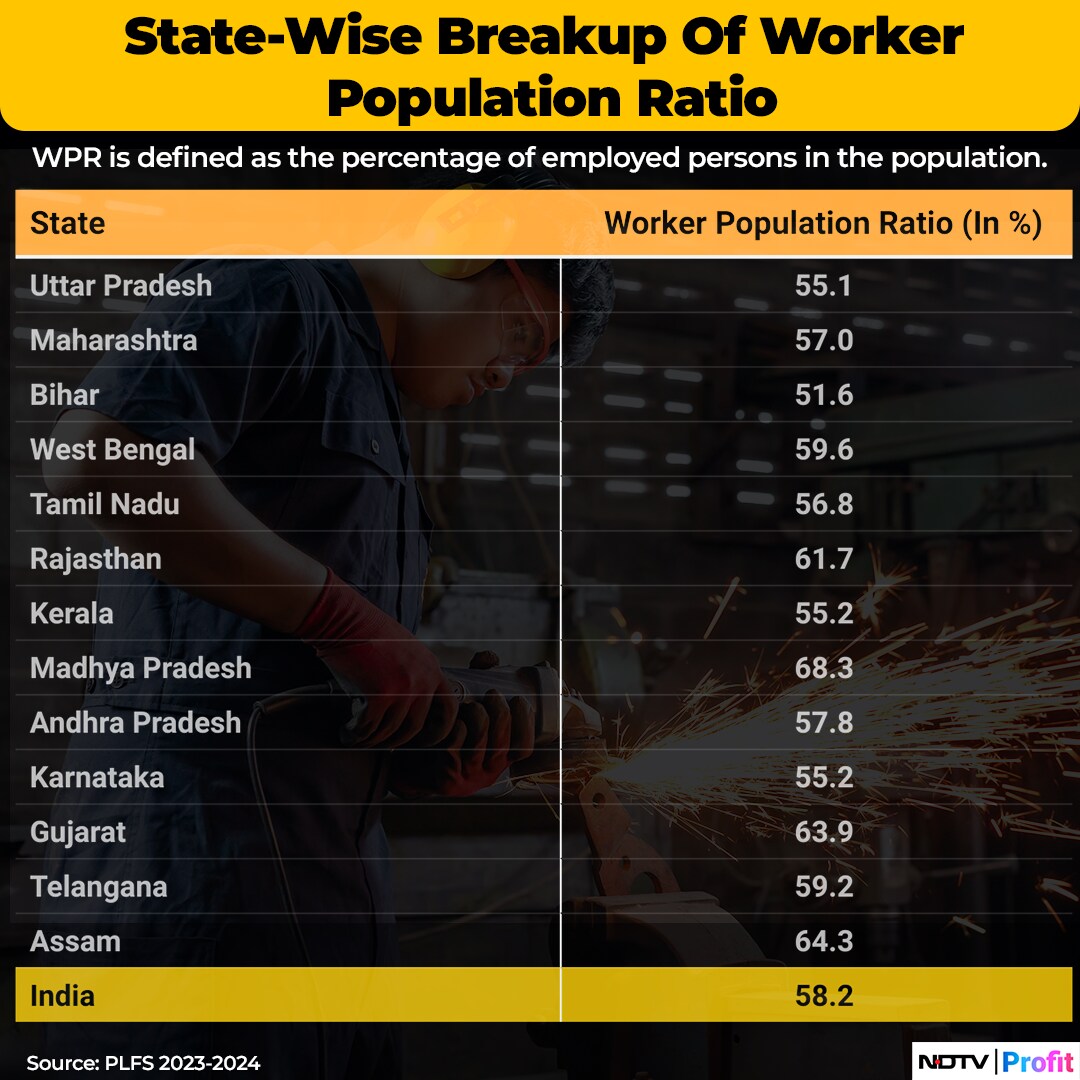
Worker Population Ratio
The worker population ratio, defined as the percentage of employed persons in the population, rose from 56% in the previous survey to 58.2% during July 2023–June 2024.
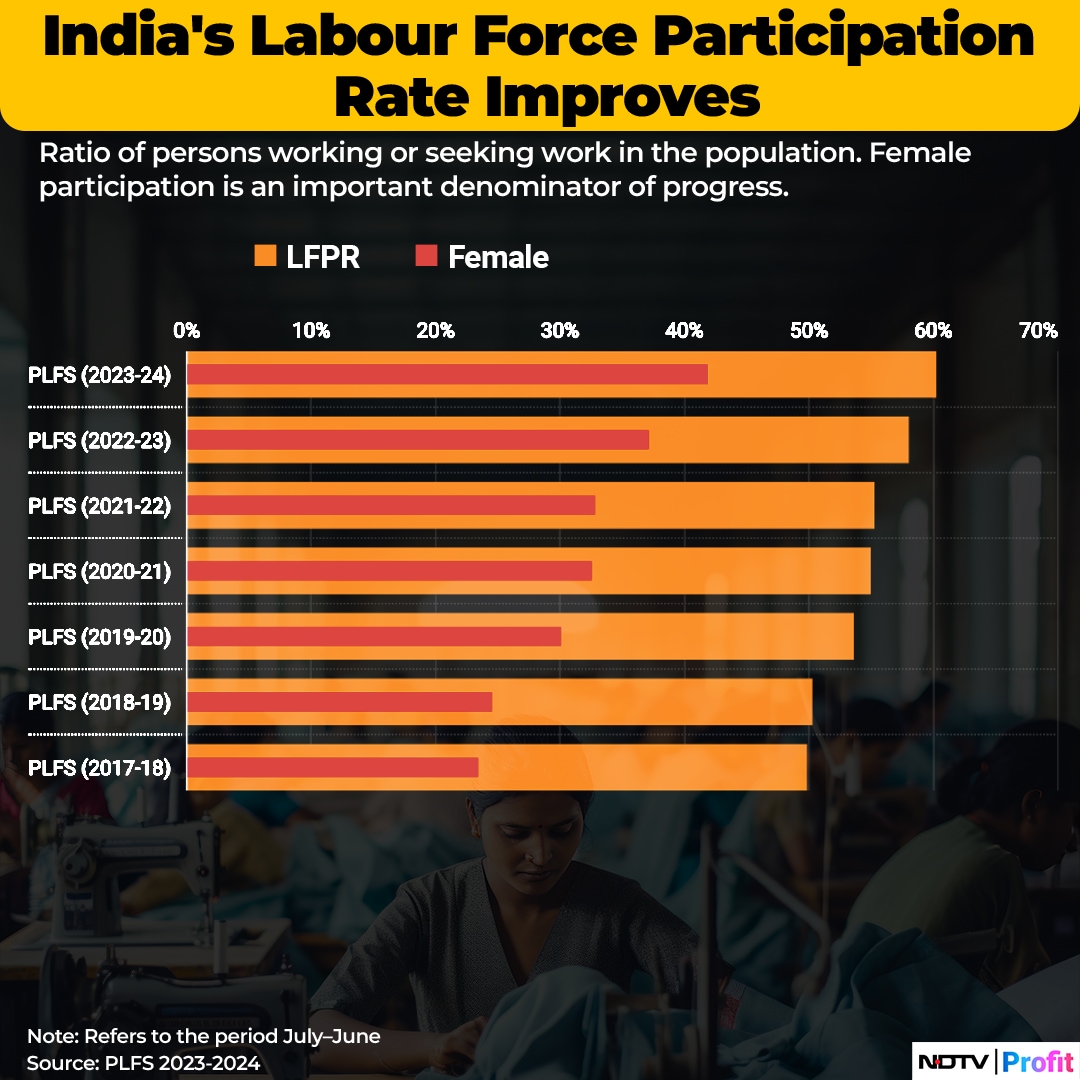
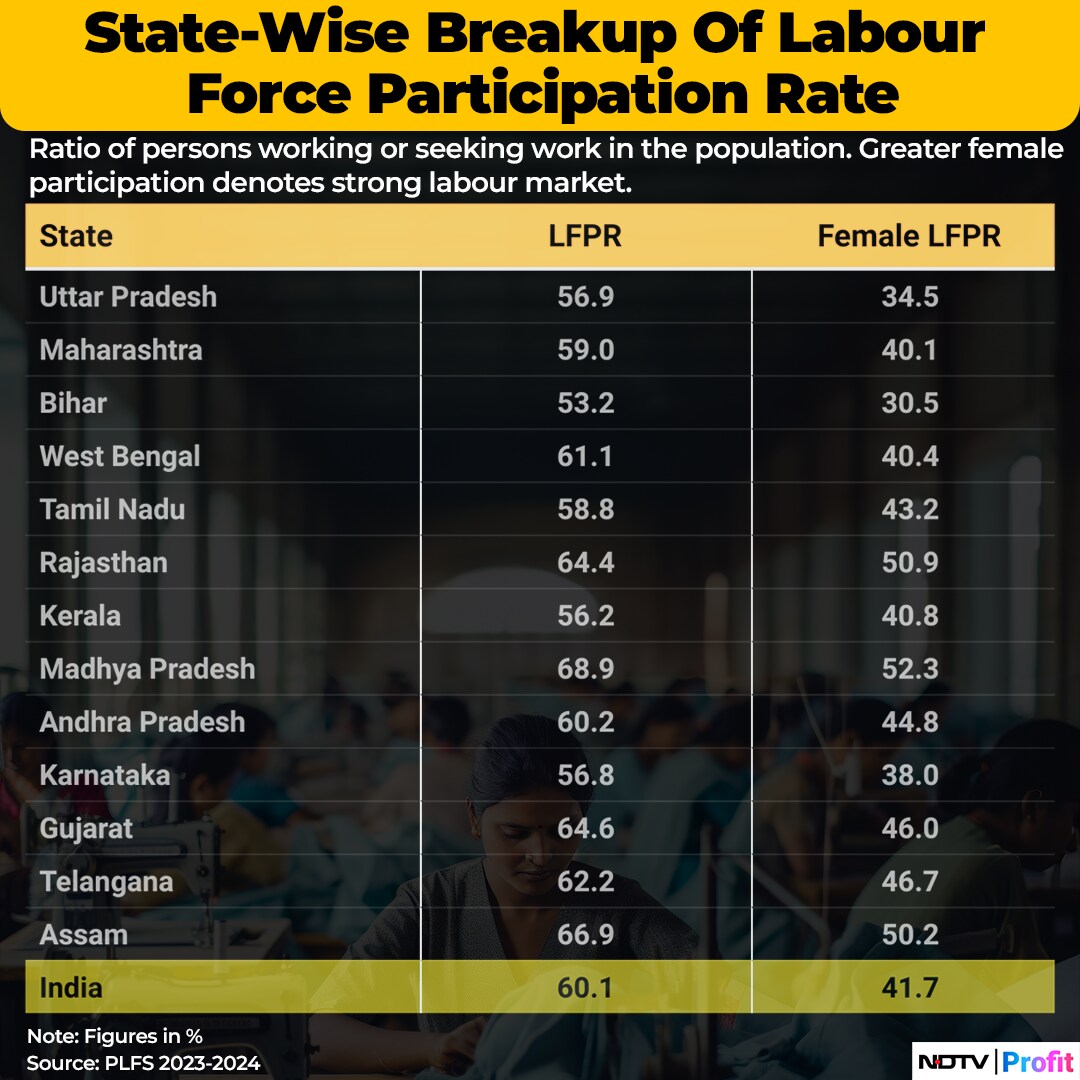
Labour Force Participation Rate
India's labour force participation rate, which shows the ratio of persons working or seeking work as a proportion of the population, has seen a consistent increase over the last six surveys.
LFPR in usual status for persons of all ages was 60.1% during July 2023–June 2024, higher than 57.9% in the previous year.
The rise was led by females, from 37% in 2022–23 to 41.7% in 2023–24. For males in India, LFPR increased to 78.8% in 2023-24, from 78.5% in 2022-23.
Among large states, Madhya Pradesh had the highest labour force participation as well as for women.
Essential Business Intelligence, Continuous LIVE TV, Sharp Market Insights, Practical Personal Finance Advice and Latest Stories — On NDTV Profit.